Data analysis of NYC landmarks since 1965 reveals trends and biases in the landmarks preservation movement.
Developed with urban historian Kenneth Jackson at Columbia University’s Department of History
.
.
A visual history of landmarks preservation in NYC. Data from NYC Open Data. Music from Freesound.
.
Introduction
There is ongoing debate between in NYC between developers seeking to rebuild the city in the image of global capitalism and preservationists seeking to slow the rate of change and protect the appearance of the city’s many and distinct neighborhoods. Several factors drive historic preservation: fear of losing heritage; fear of change; historians, public servants, and well-intentioned activists in the spirit of Jane Jacobs. This debate has played out every year since 1965 through the hundreds of structures that are added to (or rejected from) the Landmarks Preservation Commission’s running list of landmarks (LPC). Once added, landmarked buildings cannot be modified without first seeking approval from the city. Landmarks preservation is contentious for developers because the protections of preservation law are permanent and affect all current and future owners. Preservation law further restricts significant rebuilding, even if demolition and rebuilding are lucrative for the property owner.
Historians decide the future of the city’s built environment. The sites they preserve will become the architectural lens through which future generations will appreciate the past. The sites they approve for demolition will be lost to history. Preservation is a response to larger historical questions: Which aspects of the past are worth preserving? How should the city balance the economic need for development with the cultural need for history?
This paper will assess the landscape of historic preservation through analysis of publicly-available landmark records from NYC Open Data. We identified two datasets, both containing ~130,000 spreadsheet entries for every single LPC listing from 1965 to 2019. The first dataset is titled “Individual Landmarks” 1 and includes the structure’s address, lot-size, and date landmarked. The second dataset is titled “LPC Individual Landmark and Historic District Building Database” 2 and includes the construction date, original use, style, and address of all structures. We downloaded both datasets as .csv files, imported them into a visualization software called Tableau, merged them into a single map, and then analyzed the data. The results of inform the conclusions presented here. This analysis is broken into four case studies:
-
Distribution of Landmarks over the Five Boroughs
Assesses where landmarks preservation is densest or least dense by neighborhood. -
Contextual Preservation?
Analyzes how protecting a landmark limits redevelopment of neighboring properties of less aesthetic value -
How does the preservation movement reflect economic patterns?
– Factor affecting the preservation of city-owned structures
– Factors affecting the preservation of residential structures
– Relationship between preservation and gentrification?
-
Keeping up to pace?
Questions the degree to which landmarks preservation succeeds in protecting recently-built landmarks
From this data, hidden trends and biases in historic preservation become visible. Firstly, we identify a higher-density of landmarks in certain (and usually higher income) neighborhoods. Secondly, we identify a marked preference among historians for protecting structures pre-1945. (Is there so little in the city’s recent architectural history that is worth preserving?) And thirdly, our analysis hints at the strength of market forces and developers in shaping the scope and definition of preservation.
Read More
.
.
Study One:
Distribution of Landmarks over the Five Boroughs
.
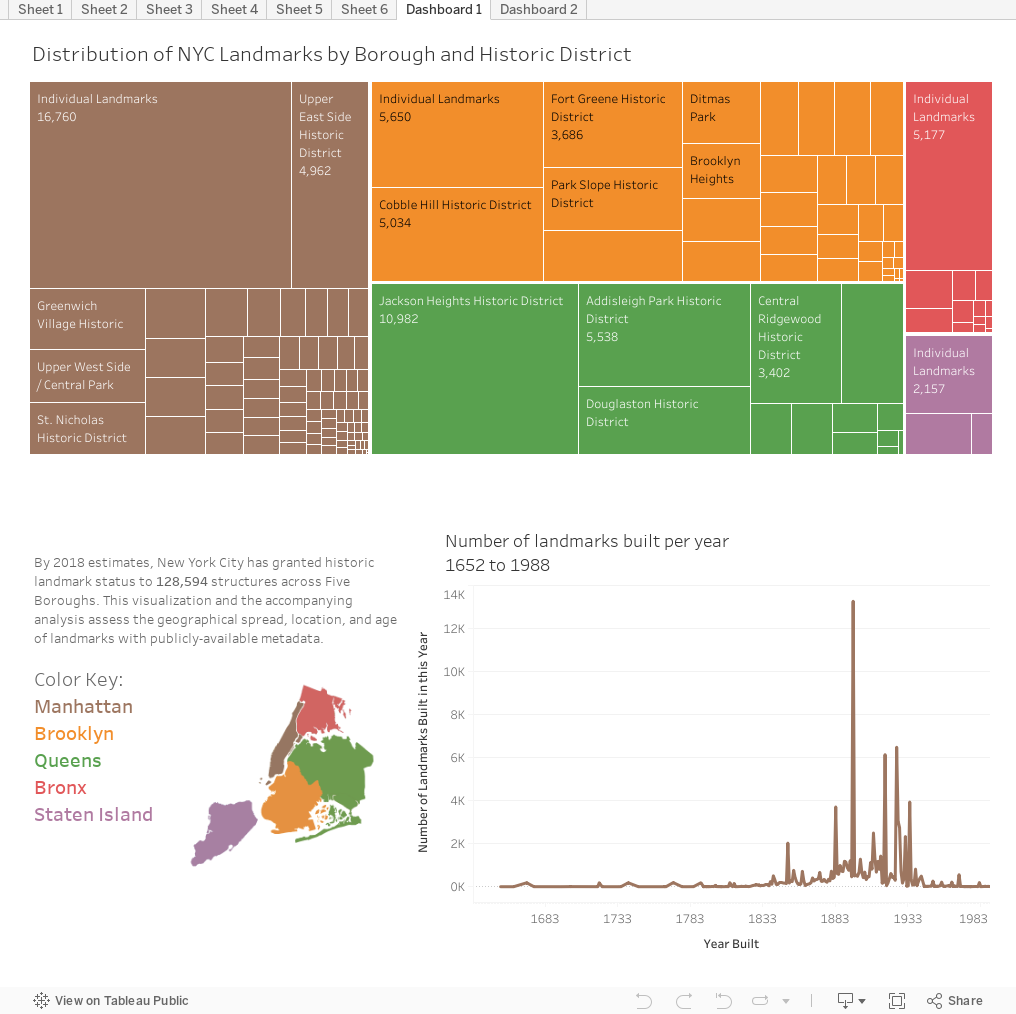
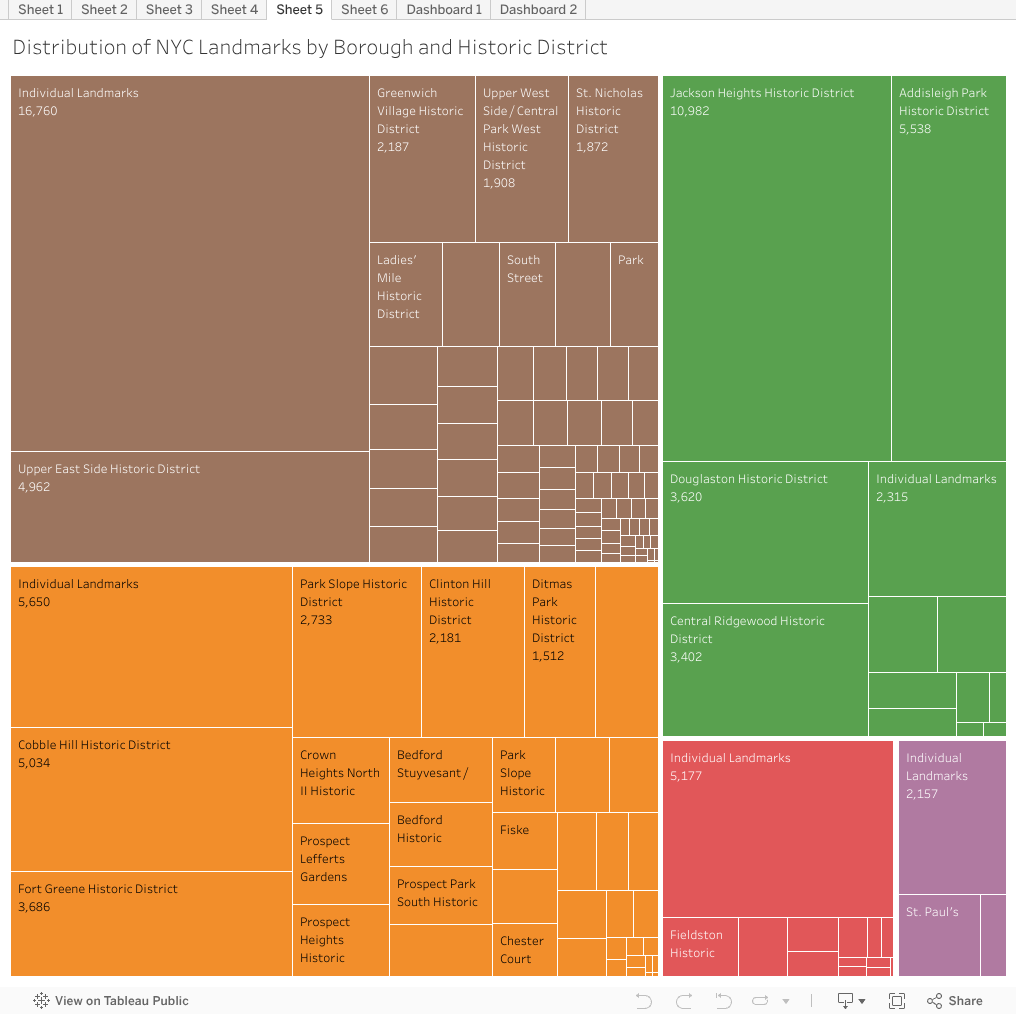
The tree map below shows the distribution of all 128,594 landmarks across the city. This includes both buildings and non-buildings like street lamps, parks, statues, and bridges. Each rectangle is scaled to reflect the number of landmarks within that borough’s historic district – the larger the box, the more buildings. The largest rectangle for each borough represents the number of individual landmarks that fall outside any historic district. Boxes are grouped and colored by borough: Manhattan, Brooklyn, Queens, Bronx, and Staten Island.
.
![]()
125,594 records above
.
Several trends are visible. For instance, Manhattan, with a population 19.3% of the citywide total, 3 has 30.46% of the landmarks. By comparison, Staten Island, with 5.55% of the population, has 16.24% of landmarks, which is the greatest number of landmarks relative to the smallest population. By contrast, the Bronx with 17.06% of the population has only 5.36% of landmarks, which is the least number of landmarks relative to population size and density.
Given that the Bronx’s land area (42.47 mi²) is comparable to Staten Island (58.69 mi²), and given that their histories are both rich, then does the Bronx objectively have fewer landmarks worth preserving? Or do preservation trends follow patterns of economics and race – with wealthy neighborhoods having stronger legal and political leverage to preserve their built environment?
.
| Manhattan | Brooklyn | Queens | Bronx | Staten Island | |
|
% of NYC population in this borough (8.623 million total) |
19.30% | 30.72 | 27.36 | 17.06 | 5.55 |
| % of NYC landmarks in this borough | 30.46% | 25.65 | 21.98 | 5.36 | 16.24 |
| Surface area | 22.82 miles2 | 69.50 | 108.10 | 42.47 | 58.69 |
.
Historic preservation does not operate off of a tabula rasa with objective standards and processes. There are spatial patterns to urban growth and income inequality; privilege (or the lack of privilege) is concentrated in specific neighborhoods. The geography of historic preservation follows similar patterns.
.
128,212 records above
.
Study Two:
Contextual Preservation?
.
A common criticism is that preservation stifles economic development. Preservation prevents demolishing and replacing older structures with larger and more profitable new ones. A lengthy (and expensive) approvals process is also required to modify old buildings. A city committee reviews applications and suggests revisions to ensure that new development is “contextually” respectful of its neighbors and/or preserves as much of the historic building’s fabric as possible. 4
Developers often claim historic preservation discourages development and reduces profits. Our data does not support this claim. Developers claim that protecting one building can limit the redevelopment of neighboring buildings. This criticism applies to vacant parcels within historic districts. This critique also applies to non-historic and non-landmarked buildings that fall within historic districts, but whose redevelopment might weaken neighboring landmarks. Construction vibrations and foundation vibrations on non-historic properties often destabilize and damage nearby landmarks, which is something developers need to address when seeking approvals from the city.
Within the city’s unequal fabric with pockets of concentrated wealth, poverty, and history, there are three general categories of protected buildings.
Firstly, there are individual landmarks, such as bridges, train stations, statues, and street furniture. While aesthetically and historically important, these sites are stand-alone pieces. New development can occur nearby with few restrictions. Historical review is not required for neighboring properties; only construction permits are needed. The case for protecting individual landmarks is strong; the nomination was written and approved on a case-by-case basis. Grand Central Station and Saint Patrick’s Cathedral are two examples. The size, beauty, and appearance of these buildings often make them into symbols of the city and defining features of a neighborhood’s identity.
Secondly, there are historic districts. Unlike individual landmarks of singular aesthetic value, historic districts are valuable because they form streetscapes. For instance, while individual structures in the Greenwich Village are unremarkable, together they form a unique streetscape worth preserving. A vibrant streetscrape includes structures of various ages, uses, functions, and sizes. In these districts, new development must not be much taller than and must not employ different materials from neighboring historic buildings. From the 2018 city-wide ordinance, zoning aims “to protect the character of certain designated areas of historic and architectural interest, where the scale of building development is important, by limitations on the height of buildings.” 5
.

303 President Street, Carroll Gardens: The brownstone in center used to resemble its neighbors but was modified before the neighborhood was made a historic district in 1973.

55 West 83rd Street, Upper West Side: This c.1950 building on left has no historic value, but it is surrounded by historic structures on either side and across the street. Hence, some of the legal protection for the neighbors are extended to this building, too.
.
Thirdly, there are, however, many non-historic and vacant parcels within historic districts. Many of the protections applied to historic buildings are extended to neighboring sites. Development on these less important sites can enhance or destroy the streetscape. For instance, most buildings in a neighborhood may retain their original appearance, but a few interspersed between were built later in a different style, or they were in some way destroyed before the area was landmarked. These structures are preserved not because of what they look like, but because of where they are located. Above are two examples.
In the case against historic preservation, contextual preservation seems the most flawed. The red tape of preservation law might disincentive needed investment in these non-contributing structures. However, fewer than 15% of all structures within historic districts are listed as non-contributing. The data is broken down below, by borough and for the city at large:
.
| Borough | Manhattan | Brooklyn | Queens | Bronx | Staten Island |
NYC Totals |
|
Designated structures (individual and districts) |
32,376 | 28,680 | 25,560 |
17,325
|
5,344 | 109,285 |
| Non-contributing structures within historic districts | 6,465 | 3,783 | 2,626 | 3,118 |
1,512
|
17,504 |
| Number of vacant parcels within historic districts | 40 | 457 | 74 | 444 | 29 | 1,044 |
| Percentage of buildings in historic districts that are non-contributing and/or vacant | 16.731% | 13.713% | 9.5541% | 17.054% | 22.38% | 14.74% |
| Borough totals | 38,881 | 30,920 | 28,260 | 20,887 | 6,885 | 127,833 (all five boroughs) |
| Landmarks outside of any borough | 761 | 128,594 (total) |
.
This yields 128,594 6 protected structures city-wide. There are 857,271 structures total in the city. 7 which means that landmarked buildings comprise less than 14% of all structures in the city. In addition, the non-contributing buildings and vacant parcels within historic districts comprise less than 2.16% of the city’s built environment. New York City contrasts with comparable world cities like Paris and London, which are millennia older and protect a far greater percentage of their historic fabric. Below, for instance, are maps of the conservation areas in Westminster, London 8 versus Lower Manhattan and Downtown Brooklyn. 9 In other words, preservation law is limited to certain buildings and certain areas; it is too small a factor to drag down the larger city’s growth.
.

Conservation areas in Westminster, London

Historic Districts in NYC
.
Study Three:
How does the preservation movement reflect economic patterns?
.
This section is divided in three parts. We first describe why civic structures are the easiest and most likely to be preserved. We then describe the economic factors why commercial structures (3.56% of all landmarks) are less likely to be preserved than residential structures (27.66% of all landmarks). Finally, we hint at possible correlations between landmarks preservation and gentrification.
.
3.1 Civic Buildings
Civic structures tend to be better preserved. New York City owns at least 14,000 properties 10 across the five boroughs. However, there are 16,920 landmarks that serve “civic” functions, including 11,726 landmarked buildings relating to public health and 571 related to armories. In fact, among all 440 types of landmarks, civic-related structures and institutions have the highest rates of landmark status and preservation.
What explains this? One explanation could be that civic sites, particularly neoclassical buildings from the Gilded Age, tend to be high-quality, well-built, and aesthetically pleasing, so as to evoke the power of government through architecture. Therefore, these buildings seem more likely to be deemed worthy of preservation.
An alternative explanation could be that civic and residential structures are easier to landmark than commercial. Elected officials are responsible for maintaining city property, and they must respond to voter and community pressure. The public can threaten to vote out officials who neglect historic, city-owned properties. Additionally, there are few reasons for developers and residents to object to preserving civic buildings.
Still yet, there are stronger factors influencing preservation. Civic structures are not subject to market pressures, and city-owned buildings do not have to help their occupants make a profit. For instance, the cost of renovating a historic public school might be more expensive. Fortunately, the city is not a profit-driven corporation. By contrast, a developer is always looking to extract the greatest profit possible from the land he owns.
Commercial structures are subject to strong market pressures favoring demolition. An old factory that has outlived its designed lifespan will be abandoned or demolished if it cannot be re-used. Converting an old factory to new uses is often cost-prohibitive, requiring environmental remediation, and lengthy approvals. If renovation cannot generate enough profit, there will be pressure to demolish. City-owned libraries and hospitals do not face this kind of pressure. This drives private developers to demolish their properties at a higher rate than public institutions, as illustrated by how few commercial structures are preserved (3.56% of all landmarks).
.
3.2: Residential vs. Commercial
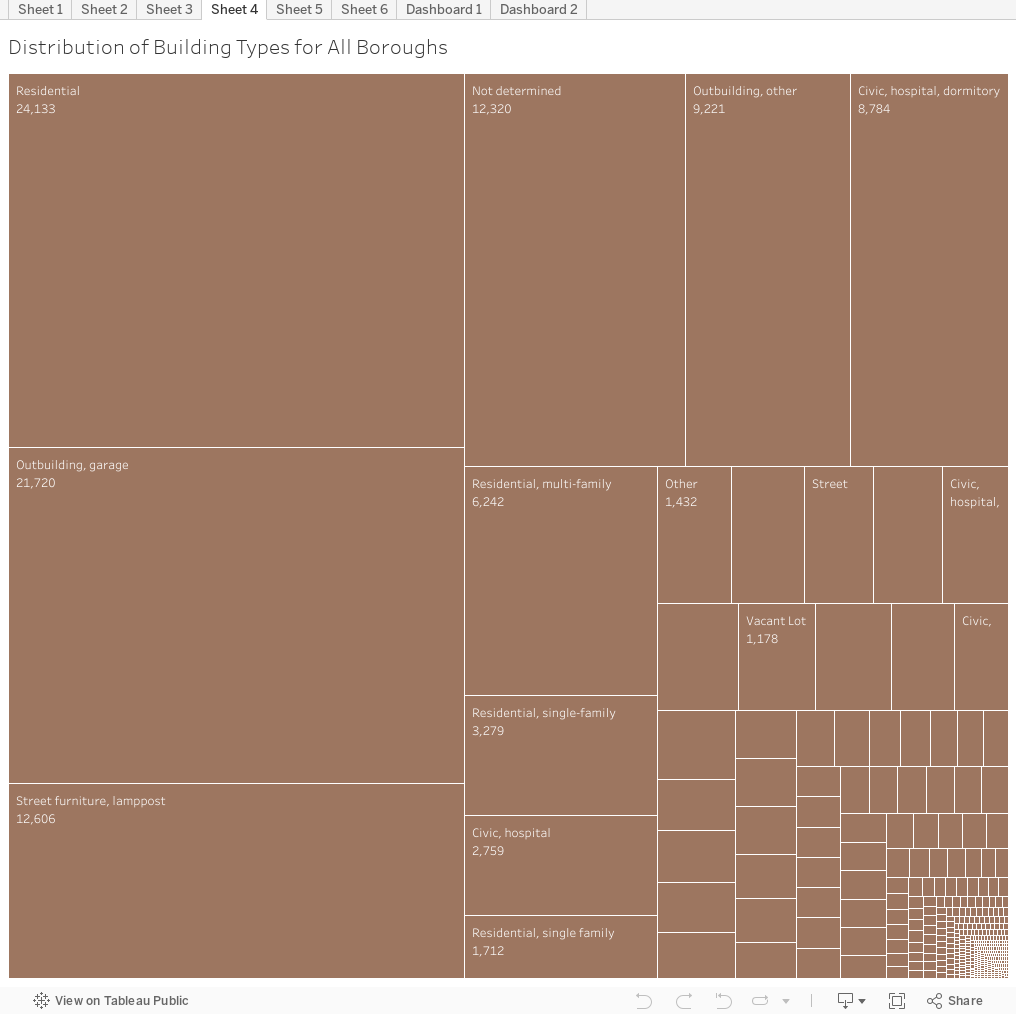
With increasing land values, newer buildings are less likely to be low-density single-family homes and more likely to be high-density commercial and mixed use. However, the city seems to prefer landmarking residential over commercial structures. The table below show the building types preserved, their quantity, and the percentage of the total number of preserved buildings each building type represents. Structures are categorized by their original functions. So a building designed as a factory but later converted to residential is still listed as “industrial.”
.
| Type of Building | Number of Buildings of this Type | Percent of Total (rounded to .01) |
| Residential | 35,575 | 27.66% |
| Civic | 16,920 | 13.16% |
| Street Furniture | 13,943 | 10.84% |
| Commercial | 4,574 | 3.56% |
| Infrastructure | 2,490 | 1.94% |
| Transportation | 2,145 | 1.67% |
| Institutional | 2,026 | 1.58% |
| Religious | 1,509 | 1.17% |
| Mixed Use | 1,324 | 1.03% |
| Vacant | 1,178 | 0.92% |
| Military | 759 | 0.59% |
| Industrial | 436 | 0.34% |
| Outbuildings 11 | 32,391 | 25.19% |
| All other uses | 14,970 | 11.64% |
| Totals | 128,594 | 100% |
.
The most important figure above is the disproportionate representation of residential and civic buildings that are landmarked. For instance, as of 2018, Manhattan has 39,172 landmarks. Of these, 35% (= 13,816) are for residential use, 9% (= 3,443) are commercial, and 1.5% (= 650) are mixed-use. Mixed use usually means commercial at ground level and residential on top. Even though more people work in Manhattan than live there, the city has preserved four times more residential than commercial structures on the island. On weekdays, 3.1 million people work in Manhattan, while only 1.6 million live here. In other words, residential buildings seem more likely to be preserved than commercial.
Our data also reveals a spatial concentration of residential buildings in historic districts. For instance, most of Manhattan’s residential landmarks are concentrated within historic districts in the Upper West Side, Upper East Side, and the skyscraper valley between Midtown and Downtown. Residential sites are more likely to be collectively landmarked as part of historic districts and streetscapes. As illustrated below, 94.93% of residential landmarks citywide fall within historic districts, and only 5.07% are outside these districts:
.
| Residential | All Other Types | |
| Within historic districts | 35,029 = 94.93% | 61,124 = 66.66% |
| Individual landmarks outside historic districts | 1,872 = 5.07% | 30,569 = 33.34% |
| Total | 36,901 | 91,693 |
.
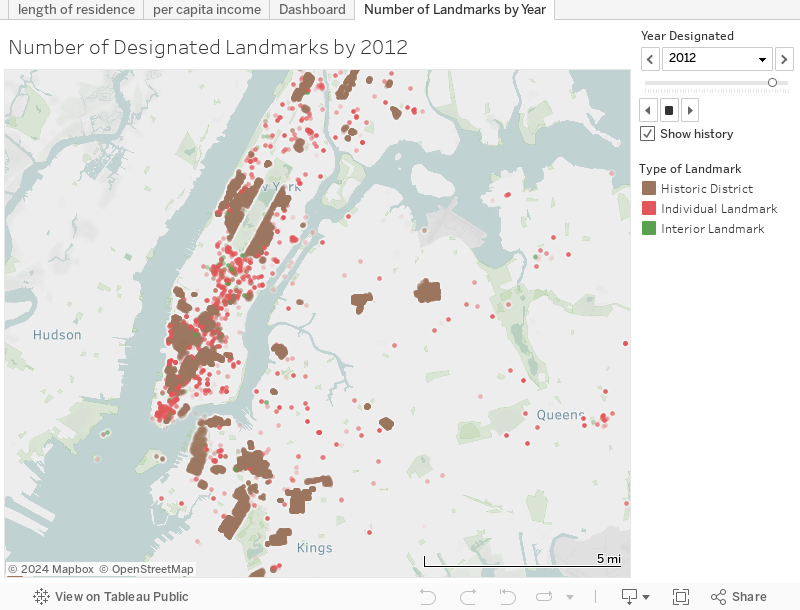
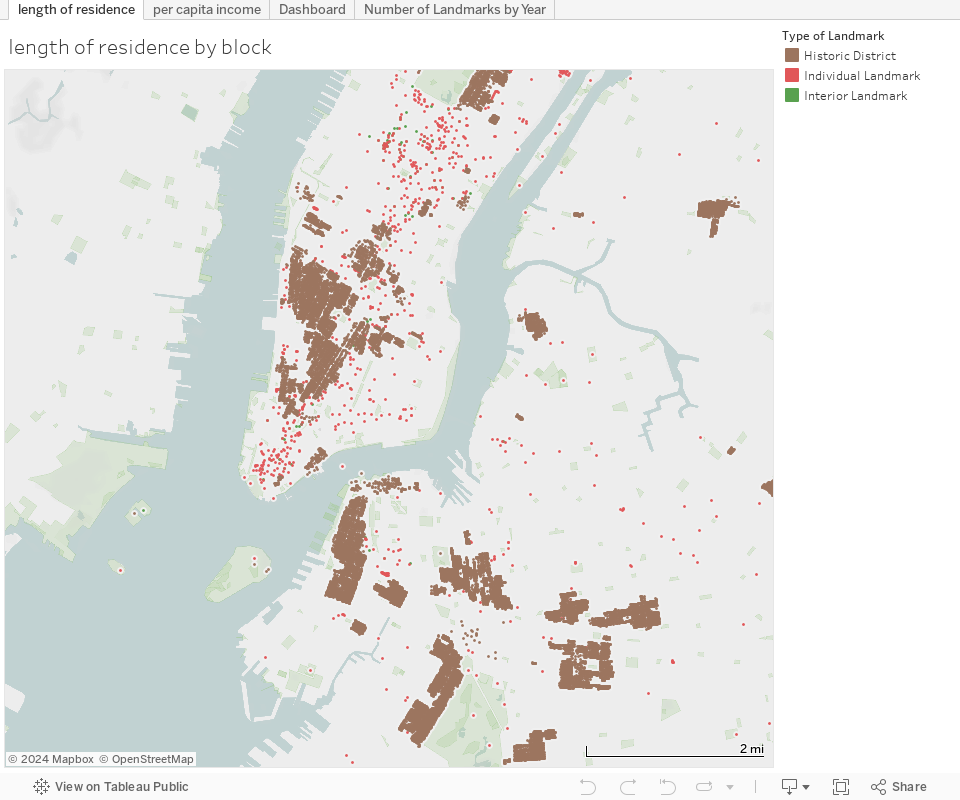
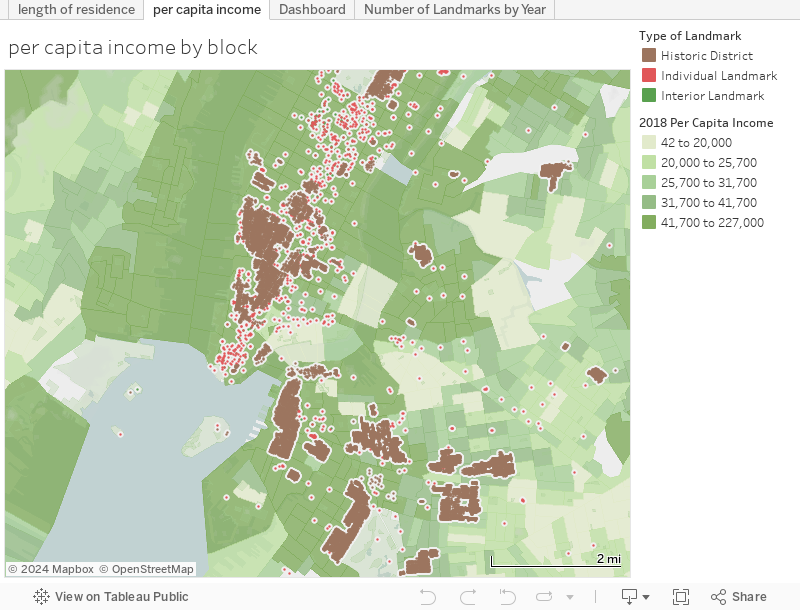
What explains the disproportionate protection of residential structures? One factor could be higher income-levels in historic neighborhoods and associated protectionism (i.e. NIMBYism). The map below shows the correlation between the locations of historic districts and 2018 data on income levels and length of residence. Historic districts overlap with neighborhoods of higher incomes and longer-term residents. For instance, most residents in the Brooklyn Heights historic district have lived there for between 17.1 and 48 years, and their annual incomes range between $51,500 and $289,000. People in the rest of Brooklyn have lived at their current address for between 10.3 and 12.8 years, and their annual income is $51,500. Similar patterns play out in the historic districts of the Greenwich Village and the Upper West Side. In other words, residents in historic neighborhoods are more likely to stay-put.
Length of residency and percentage of home ownership may mirror the degree to which residents are invested in maintaining and improving their immediate built environment. The relationship between historic preservation and length of residency is too strong and too consistent across all five boroughs to be a mere accident. There may be causative factors at play between income, emotional investment in one’s community, and the willingness to fight for historic preservation. This needs to be further analyzed and confirmed with future data.
.
Launch interactive feature (opens in new tab)
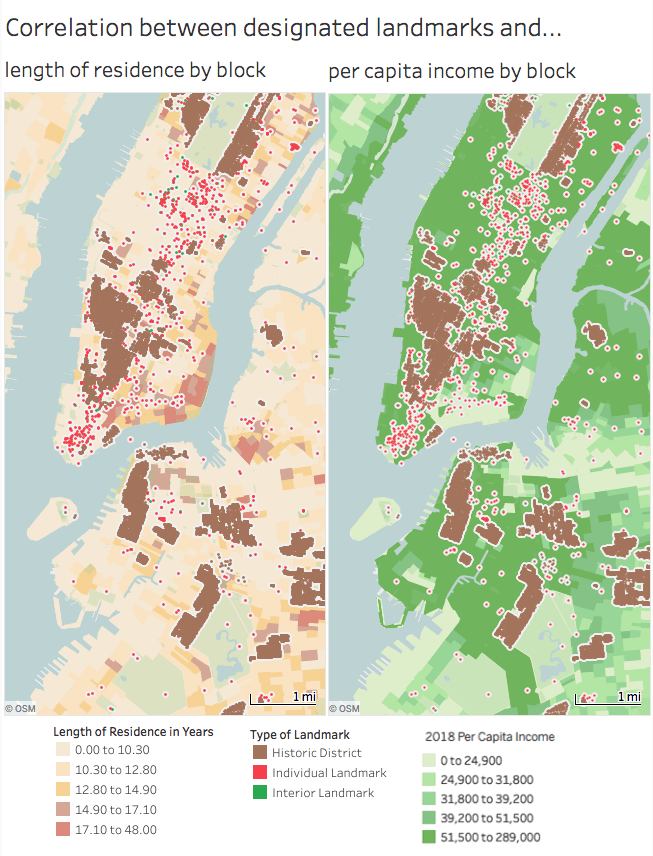
Individual landmarks outside historic districts tend to be commercial structures.
There is no visible relationship between the siting of individual commercial landmarks
and the income levels of their adjacent community.
.
3.3 Gentrification?
The spatial relationship illustrated above is surprising for another reason: gentrification. Gentrification is often linked to rising living costs and the displacement of existing residents. The physical appearance of historic neighborhoods would seem to make them more desirable for gentrification. However, the average length of residency is longer in historic than in non-historic districts, even though income (and rent, too) are higher in historic districts. In other words, neighborhoods that fall within historic districts more often have high or rising incomes and longer length of residency than residents from non-historic districts. This seems contradictory because one would think that high-income areas would be more likely to displace existing residents, and therefore would be less likely to have long-term residents from the pre-gentrification era.
In contrast, neighborhoods without the benefit of historic preservation more often have more short-term residents and a high annual turnover rate. The Williamsburg neighborhood is one example with incomes over $51,500 (similar to Brooklyn Heights) but length of residency under 10.3 years. Additional research should examine if rent-stabilized apartments are more likely to be concentrated in historic districts. The legal barriers of preservation might make it more difficult for developers to push out existing residents, gut an old building, and then rebuild it to charge higher rents. Building height restrictions in these old neighborhoods also reduce the motivation to even demolish a structure to begin with because any new structure built there would not be larger and more profitable. Unfortunately, NYC Open Data has no information on the spread or geographical clustering of rent stabilized apartments in older buildings.
The possible relationship between historic preservation and gentrification needs to be confirmed through further analysis. The results of this study would indicate if historic preservation is an effective tool to stabilize neighborhoods and slow gentrification.
.
.
.
Study Four:
Keeping up to Pace?
.
When the first group of 2,312 buildings were landmarked in 1965, their average year of construction was 1882 – representing an 83-year gap between construction and landmarking. In 2018, the average construction year of newly landmarked structures is 1908, representing a 110-year gap. Thus, in the 53 year life of the landmarks movement from1965 to 2018, the average age of a building when landmarked has increased by 37 years.
The more recent inclusion of modernist skyscrapers, like the Lever House (completed 1952 and landmarked 1982) and Seagram Building (completed 1958 and landmarked 1989), may give the impression that the criteria for what qualifies as important and worth preserving has expanded. Our data does not support this conclusion, because while recent years have seen some newer buildings granted landmark status, the rate of designation has not kept up with the rate of construction and, in fact, has fallen behind.
The graph below illustrates – for a sample size of 5,451 structures – the date a structure was landmarked on the horizontal axis measured against its construction date on the vertical axis. Structures are plotted on this graph by color. Individual dots represent individual sites. The black trend line indicates that between 1965 and 2018, the average age of new landmarks has only slightly increased. The buildings the city is protecting today are only slightly newer than the kinds of buildings being protected in the 1960s.
.
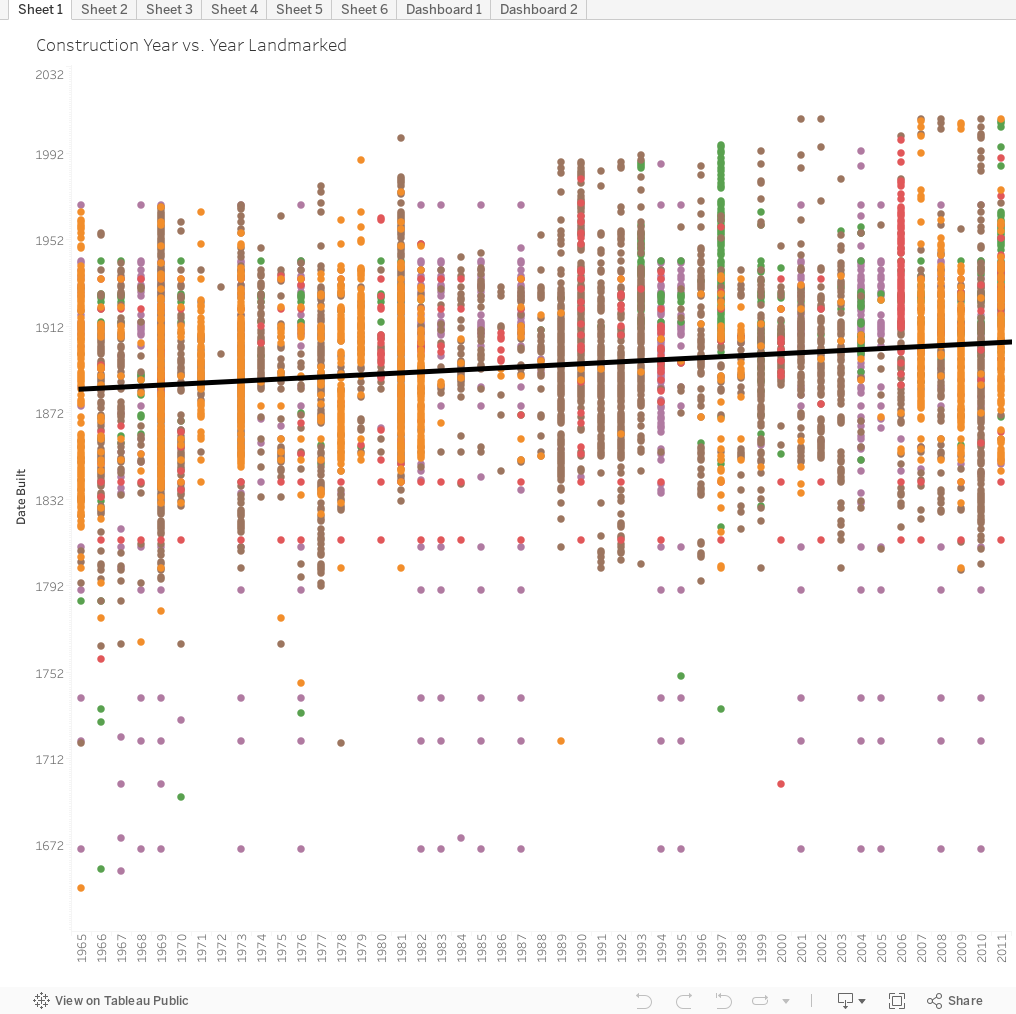
5,451 records above
.
Is the scope of historic preservation limited to the ninteenth-century? Since 1965, thousands more buildings have become eligible for landmark status, but they are not often protected. Is the city no longer building the kinds of structures deemed worthy of preservation?
To qualify for landmark status in NYC, a building must be older than 30 years (or older than 50 if added to the National Register of Historic Places). From a publication by the The Trust for Architectural Easements: “LPC property must be at least 30 years old – no exceptions – whereas a National Register property must be at least 50 years old, unless it is found to be of exceptional significance, in which case there is no age limit at all.” 12
When the Landmarks Preservation Commission was formed in 1965, none of the buildings from 1935 to 1965 qualified for protection. Today, as of 2018, any building built before 1988 can qualify. However, less than 5% of all listed structures date from the 53 years from 1935 to 1988. This was a significant and long time in this metropolis’ history, but the architectural record from this time is not well landmarked.
The graph below illustrates – for a sample size of 5,451 structures – the distribution of landmarks by year built. On the horizontal axis are the years built from the 1600s to the present-day. On the vertical axis are the estimated number of landmarks built in each year, and which are now protected. Most buildings fall within the ninety year span from 1850 to 1940, peaking in 1895. Few landmarks fall outside this time period.
The rise and falls on this graph may also correspond to the roughly twenty year cycles of boom and bust recessions, along with corresponding halts in new construction. The shortage of pre-1850 sites is explained by how the city was smaller before 1850, and therefore had fewer landmarks to begin with. However, the shortage post-1940 landmarks may hint at a larger historical oversight on the part of historians and city government.
.

93,691 records above
.
The 1965 landmarks law was part of the city’s response to the demolition of old New York Penn Station in 1963. Countless significant buildings had been lost to urban renewal in the name of progress. Activists wanted to prevent continued destruction. By the 1960s, urban renewal was winding down. New York was entering the prolonged recession of the 1970s and 80s, during which urban renewal and new construction ground to a halt. In this light, landmarks law originated as a post-facto response to demolition that had been going on for decades.
Must landmarking occur after destruction of newer landmarks has already begun? There are doubtless hundreds of post-war significant buildings that have not yet been identified or deemed worthy of preservation. The question is not: Should we list these buildings? Rather, the question should be: Why are we not listing these buildings before they are threatened? The Museum of Modern Art’s 2014 decision to demolish the American Folk Art Museum is one example of a recent building that could, or should have, been landmarked so as to prevent demolition. 13
.
Conclusion:
The Future of Historic Preservation
.
Data can only reveal so much. These statistics do not speak of specific historic sites or the unique identity of each. This data, however, reveals big picture trends, biases, and possible problems with historic preservation. These trends are invisible from street level or at individual sites; they are only visible through the lens of data. From this data-driven analysis, we draw four main conclusions:
Firstly, preservation law is subject to political pressure. The geography of historic preservation seems to preference some neighborhoods (usually higher incomes ones) over other neighborhoods with lower incomes. Preserving and restoring old buildings takes effort and money.
Secondly, many developers accuse historic preservation of slowing new construction and economic growth. Yet, landmarked buildings comprise only 14% of the city’s buildings, while non-contributing structures within historic districts comprise only 2% of all buildings. There is ample room for new development outside historic districts; development pressures on landmarked areas can be directed elsewhere.
Thirdly, residential properties are preserved in disproportionately greater numbers than commercial and industrial structures. The community and economic pressures to redevelop are different for different types of buildings. Most residential landmarks also fall within historic districts, and are therefore parts of the urban streetscape. Residents often use preservation law to protect their streetscape and the homes they own from new development that would weaken property values. Neighborhoods of lower-density old buildings, like the West Village, retain their popularity, charm, and high property values thanks to strong legal barriers against new development. Absent these protections and legal guarantees, property values could depreciate.
Linked to this third observation, the market pressures to demolish civic structures are weaker than the market pressures to demolish commercial and residential. As a result, a higher percentage of city-owned or institutional buildings are preserved, and a lower percentage of commercial and industrial.
Fourthly , historic preservationists prefer to protect pre-WWII buildings, even though numerous post-war examples qualify. As a result, there are a high number of prewar buildings with landmark status, and comparably fewer postwar landmarks. Similarly, the rate at which landmarks are designated has not kept up with the pace of new construction.
The economic success of New York on a global scale and its continuing construction boom caused the demolition of many non-residential commercial landmarks that would have otherwise qualified for landmark status had there been fewer pressures for economic development. In the words of leading NYC historian, Kenneth Jackson:
History is for losers. By that I mean, cities which have chosen to preserve all their historical monuments and locations usually do so because no one else wants the land to develop. Modern progress has passed them by. New York’s history doesn’t litter the streets visually, it can be hard to find sometimes, but that is because the city is an economic winner on a global scale. 14
New York is indeed a winner “on a global scale.” While Wall Street symbolizes America’s economic power, the United Nations symbolizes America’s political power. The city’s over three million foreign born shape the city’s identity as an interconnected and diverse metropolis.
Nonetheless, progress has an aesthetic cost, as reflected in the countless lost landmarks and in Midtown’s dark and monotone skyscraper canyons. Fifth Avenue’s Gilded Age mansions and old Penn Station are gone; so, too, are the picturesque skylines and distinctive ethnic neighborhoods of Berenice Abbott’s 1930s photographs. New York is different today. While streets and subways grow more crowded, climate, flooding, and tropical storms threaten the city’s fragile ecology and outdated infrastructure.
It is too early to judge whether the city is architecturally poorer or richer for progress. Although historians discourage speculation about the past or alternative histories, how would the political or cultural landscape of New York be like today without landmarks law? This, however, is a question data cannot answer.
.
Links to Resources
The original datasets can be viewed or downloaded below:
- Individual Landmark and Historic District Building Database from NYC Open Data
- Outlines of all historic districts from NYC Open Data
- Gentrification & Historic Preservation from Tableau Public
- NYC Landmarks Preservation from Tableau Public
.
Further Reading
Anthony Wood. Preserving New York: Winning the Right to Protect a City’s Landmarks. New York. Routledge. 2008.
.
Endnotes
- “Individual Landmarks,” NYC Open Data, https://data.cityofnewyork.us/Housing-Development/Individual-Landmarks/ch5p-r223 (retrieved 5 November 2018). ↩
- “LPC Individual Landmark and Historic District Building Database” NYC Open Data, https://data.cityofnewyork.us/Housing-Development/LPC-Individual-Landmark-and-Historic-District-Buil/7mgd-s57w (retrieved 5 November 2018). ↩
- NYC’s 2017 population is an estimated 8.623 million. ↩
- More on this topic: Rachel Mollie Levy, “Contextual Zoning as a Preservation Planning Tool in New York City,” (Master’s diss., Columbia University: Graduate School of Architecture, Planning, & Preservation, 2015) https://academiccommons.columbia.edu/doi/10.7916/D8HD7TVM (retrieved 5 November 2018). ↩
- “General Purposes of Residence Districts,” in The Zoning Resolution: Web Version, (published by NYC Zoning Department, 2018), pp.252-53. https://www1.nyc.gov/assets/planning/download/pdf/zoning/zoning-text/allarticles.pdf (retrieved 5 November 2018). ↩
- The total for all five boroughs is 127,833. Including landmarks not registered in any borough, like Ellis Island, the total is 128,954. ↩
- NYC Planning Department, “Spatial Data Properties and Metadata,” from MapPLUTO, (published to the web, 2018), pp.5 https://www1.nyc.gov/assets/planning/download/pdf/data-maps/open-data/meta_mappluto.pdf?v=18v1 (retrieved 5 November 2018). ↩
- “Conservation Areas,” City of Westminster, https://www.westminster.gov.uk/conservation-areas (retrieved 5 November 2018). ↩
- Published by NYC Zoning Department, “NYC_Historic_Districts_2016,” ArcGIS 9geographic information system), https://data.cityofnewyork.us/Housing-Development/Historic-Districts/xbvj-gfnw (retrieved 5 November 2018). ↩
- “New York City owns or leases 14,000 properties around the five boroughs—a public asset with the cumulative surface area of Brooklyn.” From: “Public Assets: Mapping the Sixth Borough of New York,” The Municipal Art Society of New York, https://www.mas.org/initiatives/public-assets/ (retrieved 5 November 2018). ↩
- “Outbuildings” include garages, stables, street furniture, and accessory structures. This category skews the data table. Since many accessory structures were turned into residential structures, the actual percentage of current residential dwellings is higher than 27.66%. ↩
- Anthony W. Robins, “Differences between Landmarks Commission Designations and National Register Listing,” in Similarities and Differences between Landmarks Preservation Commission Regulation and Donation of a Preservation Easements, (Prepared for The Trust for Architectural Easements, 2009), pp.10, http://architecturaltrust.org/~architec/wp-content/uploads/2013/06/1a-2009-0512-Robins-Report.pdf (retrieved 5 November 2018). ↩
- Michael Kimmelman, “The Museum With a Bulldozer’s Heart,” The New York Times, January 14, 2014, https://www.nytimes.com/2014/01/14/arts/design/momas-plan-to-demolish-folk-art-museum-lacks-vision.html (retrieved 5 November 2018). ↩
- “Quotes from Kenneth Jackson,” CULPA, http://culpa.info/quotes?professor_id=97 (retrieved 5 November 2018). ↩