Time-lapse History of the United States

This animation visualizes 272,000 data points spanning 220+ years of the U.S. census since 1790. With data from the National Historical Geographic Information System (NHGIS) at the University of Minnesota, I geo-referenced racial dot maps for all ten year intervals since 1790. Overlaying and fading time-lapse cartographies into each other reveals the scale of environmental and urban change.
● Each dot represents 10,000 people.
Top ten largest cities for each decade are labeled in orange.

Musical accompaniment by Philip Glass from the 1982 experimental film Koyaanisqatsi. In the Hopi language of the indigenous peoples of Arizona, the word koyaanisqatsi means “life out of balance.”
As you watch the map, ask:
1. How is the transformation of Indigenous lands into ranches and farmlands made visible in this film?
2. How do immigration and state policies change the built environment? In what ways are immigration and the law visible from the bird’s eye view of this film?
3. How has slavery influenced the demographic landscape and sequential racial dot maps shown in this film?
4. How do changes in transportation technology – in the sequential eras of the canal, the railroad, the highway, the airport, and now the internet – impact how people settle and distribute themselves across the built environment?

.

Sources:

1. Steven Manson, Jonathan Schroeder, David Van Riper, Tracy Kugler, and Steven Ruggles. IPUMS National Historical Geographic Information System: Version 17.0 [dataset]. Minneapolis, MN: IPUMS. 2022. http://doi.org/10.18128/D050.V17.0

2. Social Explorer. https://www.socialexplorer.com/

3. U.S. population over time

4. Top ten largest U.S. cities over time

Does the American city need a new “public entrepreneur” like Robert Moses?

Performing winter 2022 at The Shed in Hudson Yards is Straight Line Crazy, a two-act play about Robert Moses. He was New York City’s leading planner from the 1930s through 1960s, responsible for 35 highways, 12 bridges, 658 playgrounds and over 2 million acres of parks. Since the publication of Robert Moses’s 1974 biography The Power Broker by Robert Caro, Moses has been variously remembered for the thousands of projects he completed, admired for those public parks that brought communities together, hated for his proposal to carve an expressway through Lower Manhattan, and despised for those infrastructure projects that divided non-White communities.
Act one builds up Robert Moses as the Oxford-Columbia educated planner but with slight populist tendencies in his construction of Jones Beach and hundreds of playgrounds. This script for public consumption is of course incomplete without the mandatory repetition – originating from The Power Broker – that bridges over the access roads to public beaches were too short for buses of Black people to pass under.
Act two takes down Moses by trotting through the usual history with mentions of the 1960s Cross Bronx Expressway. Out of 250,000 people displaced citywide for “slum clearance” and “urban renewal” projects, that highway alone displaced some 40,000 people – mostly tenements of working-class immigrants. In the final scene, a young Black architect employed in Moses’s office repeats James Baldwin’s 1963 claim that “urban renewal means … Negro removal” and confronts Moses saying that her family and everyone she knows was displaced for the Cross Bronx.
That a city planner should be the subject of an off-Broadway play speaks to the enduring power of Robert Moses in the public imagination. Robert Moses succeeded in a profession now weighed down by paperwork and bureaucracy. In his complete vision of a city and ability to execute projects in face of the odds, Robert Moses represents the total power many planners and architects today secretly – or not so secretly – wished they had. Like him or hate him, we cannot seem to forget him.

Read More

.

Who Owns Newark? A Case Study of One Building

.

“Between 2017 and 2020, 2,500 homes – more than 47 percent of the city’s one-to-four unit buildings – were sold to institutional buyers. In Newark, many of the properties were bought by completely anonymous investors, prompting the title of a report from Rutgers University law school, Who Owns Newark? Transferring Wealth from Newark Homeowners to Corporate Buyers.
As documented in this 73-page report, anonymous shell companies are now purchasing majorities of Newark homes and commercial spaces. Properties that Newark’s Black and Hispanic residents would otherwise own are now going to absentee landlords and invisible owners. The higher rate of absentee ownership is directly linked to rent increases and higher rates of eviction, particularly of poor and middle-class Black families. (source)
Just two of these several thousand properties are located at 569 and 571-577 Broad Street. Their ambiguous and hidden ownership mirrors the larger transfer of inter-generational wealth out of Newark. A case study of just these two properties parallels one for one concerns identified in the report Who Owns Newark? (source)

Read More

.

Newark Changing: Mapping neighborhood demolition, 1950s to today


Click to launch interactive mapping experience.

.

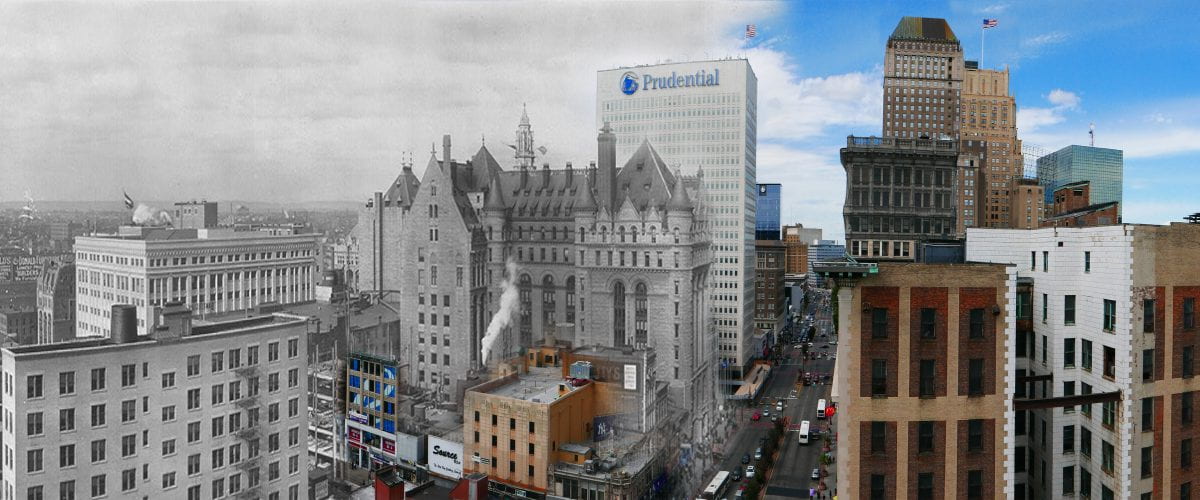
Newark Changing is a first-of-its-kind visual encyclopedia of 2,400 photo comparisons of almost every street corner​​​, home, and building ​​demolished by urban renewal and the social forces behind urban decay.​ Through an interactive and text-searchable historic map, any visitor can travel in time to explore their street and their building as it appeared in the period 1959-68 vs. today. Thousands of old street photos are brought to life with contemporary 360-degree panoramic photos of the same street scenes today, taken from identical camera angles to the old photos. This is the most extensive collection of photo comparisons past and present ever assembled for any American city.
Newark Changing reveals the scale and devastation of urban renewal, not from the aerial perspective of the city planner’s map but from the human perspective of the street corner and neighborhood. Tens of thousands of individual streets, homes, apartments, churches, and Jewish, Black, and Italian-owned businesses in Newark were “redlined” in the 1930s and deprived of investment. Most of these neighborhoods today have been bulldozed for interstate highways, universities, hospitals, and corporate investments in real estate. Billions in taxpayer money (adjusted for today’s value with inflation) was spent in the period 1945 to 1967 to demolish at least 10,000 buildings, displacing 50,000 people, 65-77% of whom were Black. At the same time, the migration of people and jobs away from urban centers deprived cities like Newark of the industrial employment base they once had. Decades after the 1967 rebellion, Newark still struggles to confront and overcome decades of harm inflicted on the city by de-industrialization and population loss to the suburbs.
Street scenes can be browsed by interactive map, by neighborhood, by subject, by street, or by the public institution responsible for demolition. Visitors can thus travel in time to explore today’s empty fields, parking lots, and desolate streetscapes for the vibrant neighborhoods they were before the automobile age.

Launch interactive mapping experience >

A park without trees creates a city without history.

Harriet Tubman Square has the largest and most impressive collection of old-growth trees in Downtown Newark. The oldest trees are over 100 feet high, four-feet diameter at the trunk, and up to 150 years old. The City of Newark’s current proposal is to cut every single tree in our park. The only historical precedent for this is the 1960s project that killed every tree in Military Park to build the parking garage now buried beneath. Based on details and architectural plans revealed through an Open Public Records Act request, this animation shows what is planned for our park:

.

Read the plans for the park.

Read our analysis of these plans.

.

.

We cheer for the historic Harriet Tubman Park for a new, prosperous, and most of all just Newark.
However, nobody should even imagine cutting down these 66 century-old trees, oaks, elms, sycamores, all of which represent our history and particularly African-American experience. In America, trees symbolize both freedom and brutal oppression, should any sensible person forget. Unlike any historic treasures – architectural remnants, shriveled old maps, aged documents, or battled artifacts – these trees are among our most valuable historic icons, standing tall for our children.
Tubman embodied the notion of reclaiming the symbolism of trees and woods as tools of freedom in the black tradition. In the antebellum America, abolitionists always voiced lyrics about glorious trees that bore the fruit of freedom. Dr. Martin Luther King famously said, “Even if I knew tomorrow the world would go to pieces, I would still plan my apple tree.” Tubman was famous for knowing the terrain of trees, woods, and swamps along her journey to freedom. In Tubman’s biography by Sarah Bradford, the black Moses said, “When I found I had crossed that line, I looked at my hands to see if I was the same person. There was such a glory over everything; the sun came like gold though the trees, and over the fields, and I felt like I was in Heaven.”
On the other hand, Billie Holiday sang about fruits produced by these trees: “Southern trees bear strange fruit/Blood on the leaves and blood at the root/Black bodies swing in the southern breeze/Strange fruit hanging from the poplar trees/ …Here is a strange and bitter crop.” The blood of black men, women, and children who refused to remain silent, and who deserve justice, life, liberty, and love, over the hate that surround them.
Last year, Rutgers Newark restored the history and voices of Frederick Douglass in the Historic James Street Commons. Let us not forget, Douglas also said, “If Americans wished to partake of the tree of knowledge, they would find its fruit bitter as well as sweet.” It is unimaginable that Tubman will allow these venerable trees of knowledge to be annihilated.

The Time Columbia Built an Artificial Moon in Low Library


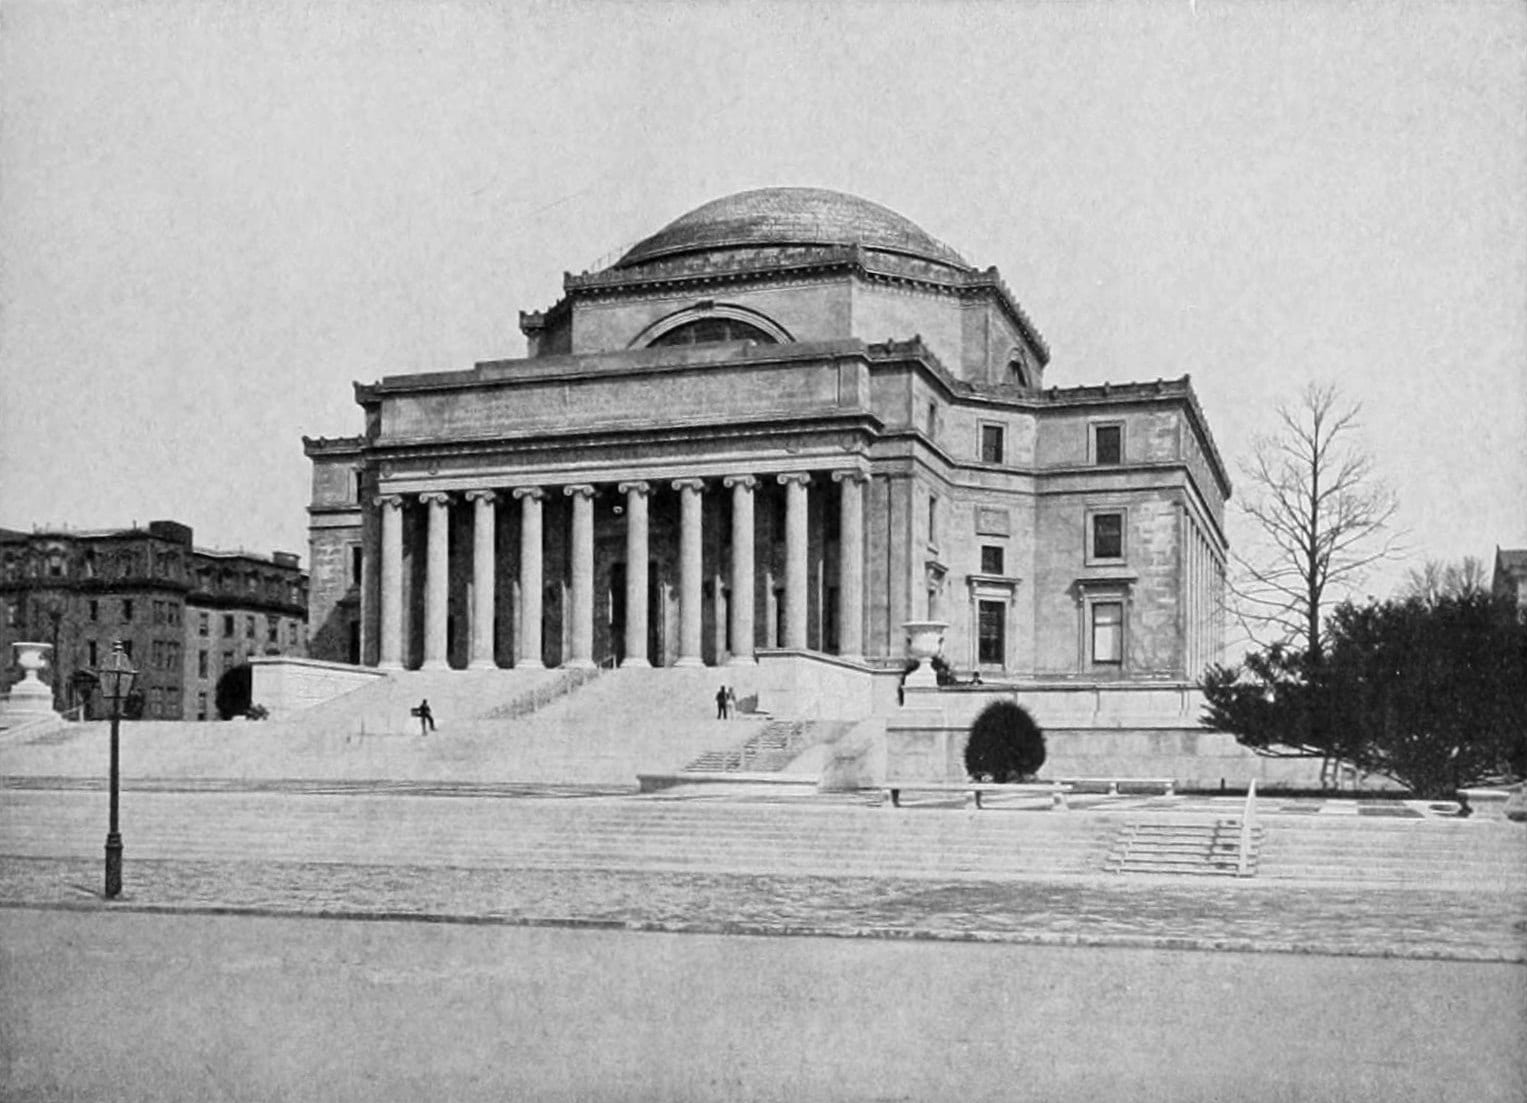
Low Library in 1905

.

The best definition of a university is, to my mind, a city from which the universe can be surveyed. It is the universe compressed into a city the size of Morningside Heights.
Aesthetically ancient but technologically advanced, Low Library rose to this challenge in the 1890s. Buried within hundreds of tons of Milford granite, Indiana limestone, and the unchanging architecture of antiquity were the latest technologies: electricity, steam heating, Corliss steam engines, and internal plumbing in a time when hundreds of thousands of New Yorkers still used outhouses and made less than five dollars a day. Flushing toilets – also known as crappers after Thomas Crapper who perfected their flush mechanism – were also a relatively new consumer product. It has always surprised me how the bathroom stalls at Low Library are divided by marble partitions of the highest quality that must weigh several hundred pounds each. Low Library was indeed built at a time when toilets were something to celebrate, in addition to books of course.
The goal of a great library was to collapse the universe into the size of a room. From the dome’s center was suspended a seven-foot-diameter white ball, which Scientific American described in 1898 as “Columbia’s artificial moon.” So that students could read by moonlight under a canopy of stars, this moon was illuminated against a dome painted dark to resemble the night sky. So in awe was Scientific American that they devoted as much page space to describing Low Library as to documenting the mechanics of this moon with mathematical formulas. With no other point of reference except candles, scientists calculated Columbia’s moon as equivalent in power to 3,972 candles.

.

From April 1898 issue of Scientific American

.

The only trouble was the lightbulbs’ carbon filament could only burn for 2.5 hours before “Columbia’s artificial moon” went dark. Scientists had not yet perfected the technologies of light. As a result, Columbia needed to replace the carbon filaments daily and could only illuminate the universe between the hours of 5:00 and 7:00 p.m. And yet, in line with Columbia’s Latin motto “In lumine tuo videbimis lumen” (In your light we see the light), Low Library was flanked by the emerging research departments of the global research university: physics, chemistry, mathematics, mining, engineering, and architecture. Then as now, these fields were seen as the frontiers of human knowledge.
For all the university’s focus on science, its core is built on the art and literature of antiquity. Low Library’s walls are several feet thick, thicker than was necessary in 1890s America that had moved on from heavy stone construction to steel-frame skeletal structures for skyscrapers and railroad stations. From Scientific American: “The imposing pile which forms the home of the college library looks down upon the great metropolis of the New World with something surely of the same pride with which the Parthenon of old surveyed the ancient Athenian city.” America – flush with wealth after conquering indigenous peoples in the American west – saw itself as inheriting the values of ancient Greece and Rome. New York, the American empire’s economic capital, needed cultural and intellectual symbols of power to match. Low Library was this symbol.

Read More

.

Racializing Space

Why does the American city remain so spatially and racially divided?

.

.

Why does the American city remain so spatially and racially divided decades after the 1960s civil rights movement? Practices like redlining, restrictive covenants based on race, segregated public transit, and literacy tests for voting have all been “abolished,” at least on paper and in theory. However, events since spring 2020 have returned to the public consciousness a reality that had always been obvious to millions of Americans living in poverty and in urban areas: that this country remains divided and that the racism of Jim Crow, rather than disappearing, has taken new forms.
Drawing from the perspectives of architecture, planning, sociology, and history, this conversation considers the evidence for how the American city and suburb – specifically Detroit – remain spatially divided and what steps must be taken to fulfill the dream of an egalitarian metropolis. Panelists include:
Karyn Lacy, professor of sociology and African American studies at the University of Michigan
LaDale Winling, professor of American history at Virginia Tech
Robert Fishman, professor of history at the University of Michigan’s college of architecture and urban planning

We cannot design our way out of this crisis.

.

Design is supposed to solve the problems of pandemic and climate crisis. This is flawed thinking. The apostles of architecture, technology, and design confront crisis with what they call “design thinking.” They claim they can design our world out of crisis through new technologies: sustainable product packaging, vegetable-based meat substitutes, paper bags instead of plastic, wind and solar instead of coal and oil. Meanwhile, the global super rich build space ships that will allow them to one day escape the mess they made of our planet. “Design thinking” becomes a way of escaping this world entirely.
The techno-optimism of “design thinking” fails to recognize that “design thinking” is itself a poison. The problem is not with design per se. Rather, the problem is with the corporate power structures in which “design thinking” operates. They promise electric cars will replace fossil-fueled cars that pollute. They promise New-Orleans-style levees and elevated houses built on stilts will reduce property damage in flood zones. They promise improved artificial intelligence will stop the virus of online hate speech. They promise we are just one more consumer purchase away from happiness. But this techno-optimism does not address the deeper questions: Why are we not designing a society in which people do not need cars? Why are we building in flood zones in the first place? Why must the profit model of social media networks rely on users spending as must time as possible on their platforms, even when boosting engagement results in exposing users to hate speech? The limited palette of “design thinking” overlooks systemic solutions that require fundamental, but overdue, lifestyle changes.

Read More

.

A Different Kind of Radiant City: Bucharest

Comparing Le Corbusier’s plans for Paris with Ceaușescu’s plans for Bucharest

.

.

Abstract: Comparing Le Corbusier’s unrealized plans for Paris and dictator Nicolae Ceaușescu’s completed plans for the Romanian capital Bucharest reveals similarities in their urban forms. Analysis of three features in both cities – their nineteenth-century urban forms, the integration of twentieth-century plans into the existing urban forms, and the political symbolism of each plan – reveals the two places as reflections of each other. The comparison matters because it establishes an unconscious aesthetic link between the progressive (almost utopian) urban designs of an architect like Le Corbusier and the repressive (almost dystopian) urban designs of a dictator like Ceaușescu.

.

Utopia and totalitarianism are both engaged in a mirroring game, tirelessly sending the same image back and forth as if utopia were nothing more than the premonition of totalitarianism and totalitarianism the tragic execution of the utopian dream. Only the distance that separates a dream from its realization seems to stand between the two.

– Frédéric Rouvillois
Utopia: The Search for the Ideal Society in the Western World [1]

.

Read More

.

Cathedral of Beauvais: Sublime Visions; Thwarted Ambitions; A Sketch

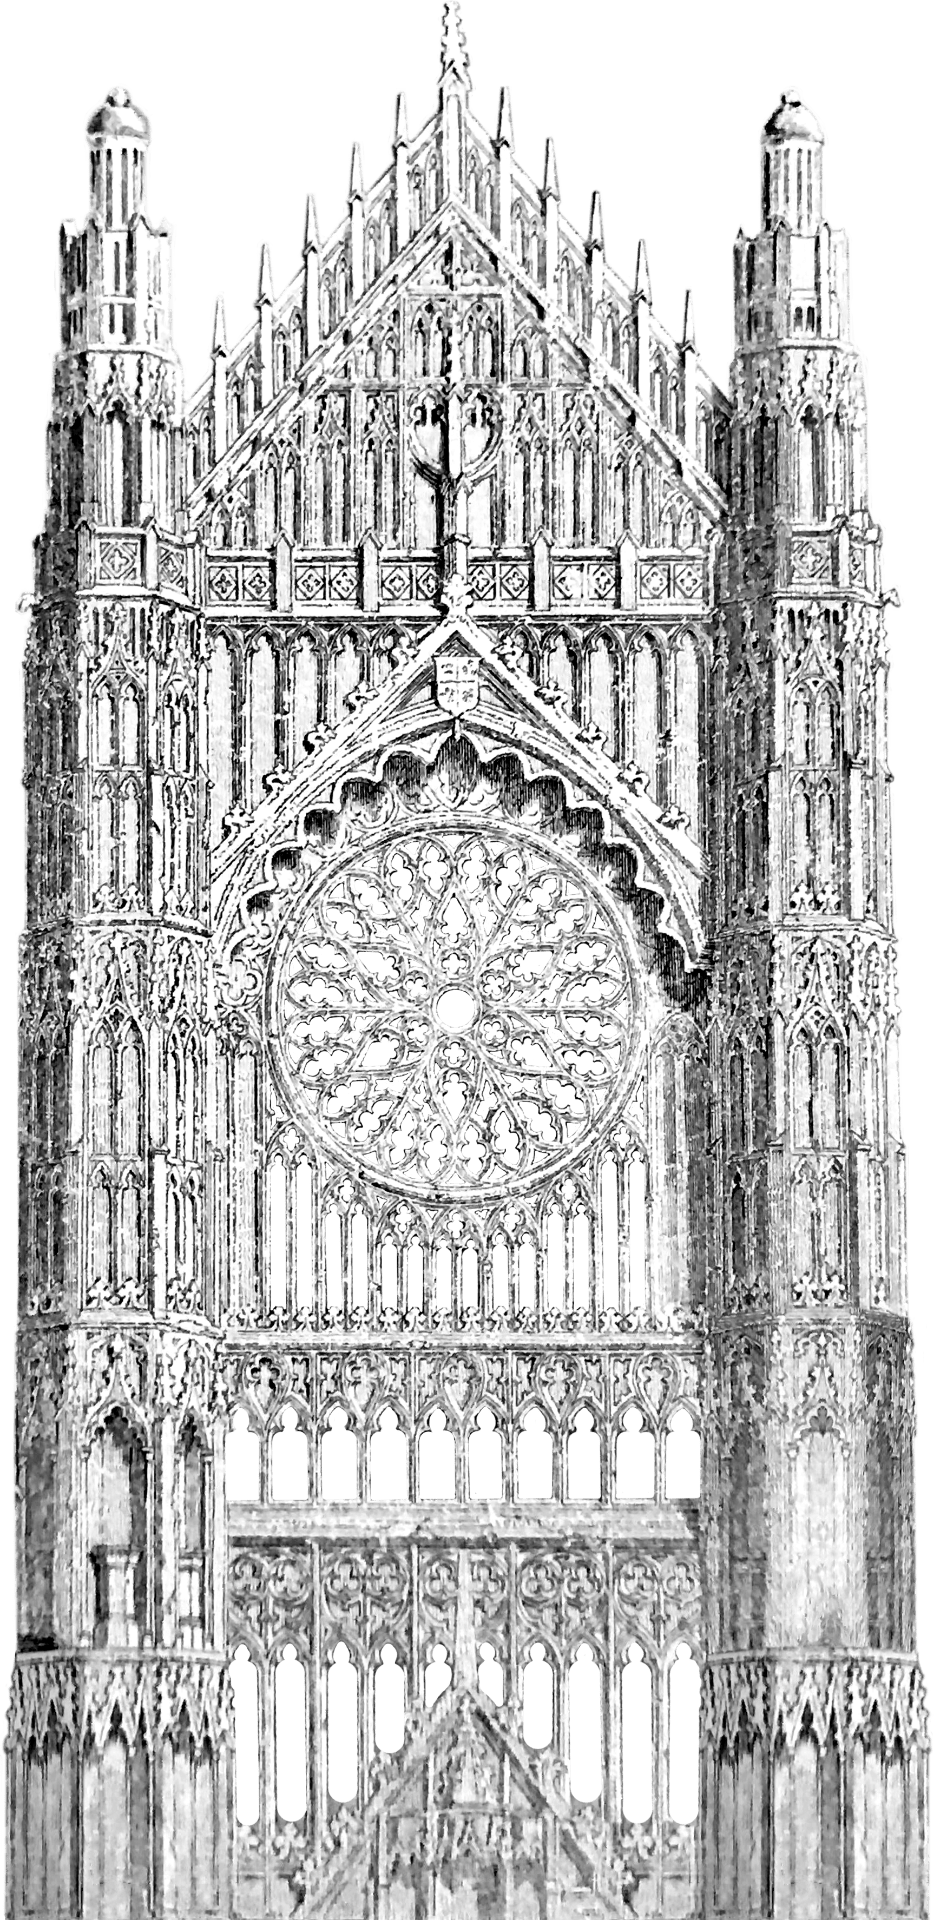
Of all the stories of the greatest Gothic cathedrals, the tale of Beauvais is the most exciting. Construction of the Gothic cathedral began in 1225 at a time of bitter turmoil when France was establishing itself as a nation within its familiar modern geographical bounds. Beauvais, the tallest cathedral in France, was never completed, having endured two major collapses and a series of structural crises that continues to this day. Our Sketchup animation follows this dramatic narrative, allowing the viewer to experience and understand the famous collapse that brought down the upper choir in 1284 as well as the underlying design features that led to that disaster. Particularly intriguing is the visualization of the short-lived crossing tower constructed in the mid-sixteenth century and the rivalry between S-Pierre of Beauvais and Saint Peter’s in Rome.
It is hoped that besides appealing to a general audience of cathedral fans, this movie will be useful in the context of the classroom at high-school and university levels.

Directed by Stephen Murray

Produced by Myles Zhang

Special thanks to Étienne Hamon

Explore more

Further reading: Stephen Murray. Beauvais Cathedral: Architecture of Transcendence. Princeton University Press, 1989.
Visit Mapping Gothic for further photos and a panoramic tour of the cathedral interior.
Visit this link to download image stills of the cathedral at various stages of completion, for reuse in print publications.

Source files

Creating this animation required creating a computer model of the entire cathedral at all stages of construction. This model is shared below; click and drag your cursor to move around this virtual space.

Email [email protected] and [email protected] for access to source files.

High-resolution image stills from construction sequence

1220s fire to 1284 collapse
Before vs. after 1284 collapse
After 1284 collapse vs. after 1300s rebuilding
1284 collapse to 1550s transept
Proposals for completing cathedral
Proposed cathedral vs. actual extent of construction by 1573 collapse
Contemporary

Image sources

Hand-drawn image textures used in this model are based on actual scanned drawings of the cathedral: floorplan, choir section, choir elevation, and hemicyle section.

Audio sources

High medieval music: Viderunt Omnes by Pérotin, 1198
Late medieval music: Ave Maria by Josquin des Prez, c.1475
Contemporary cathedral: Pierre de Soleil by Philip Glass, 1986
Sound of material buckling
Sound of structural collapse