Music: “The Language of Cities” by Maserati
1. The Animation
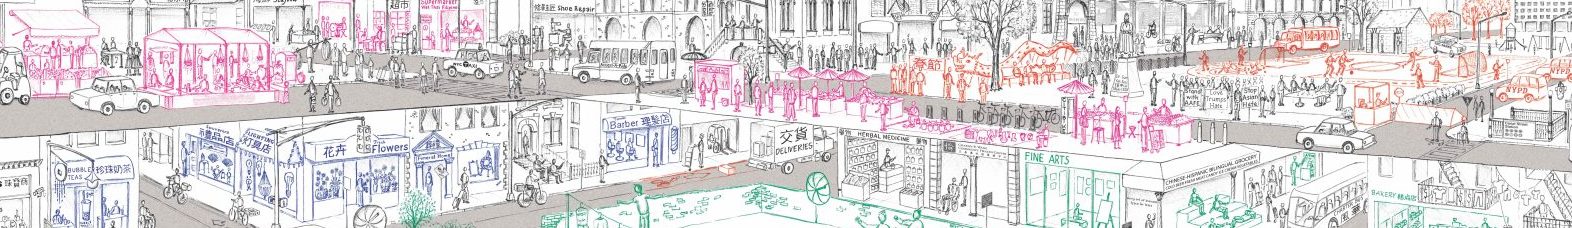
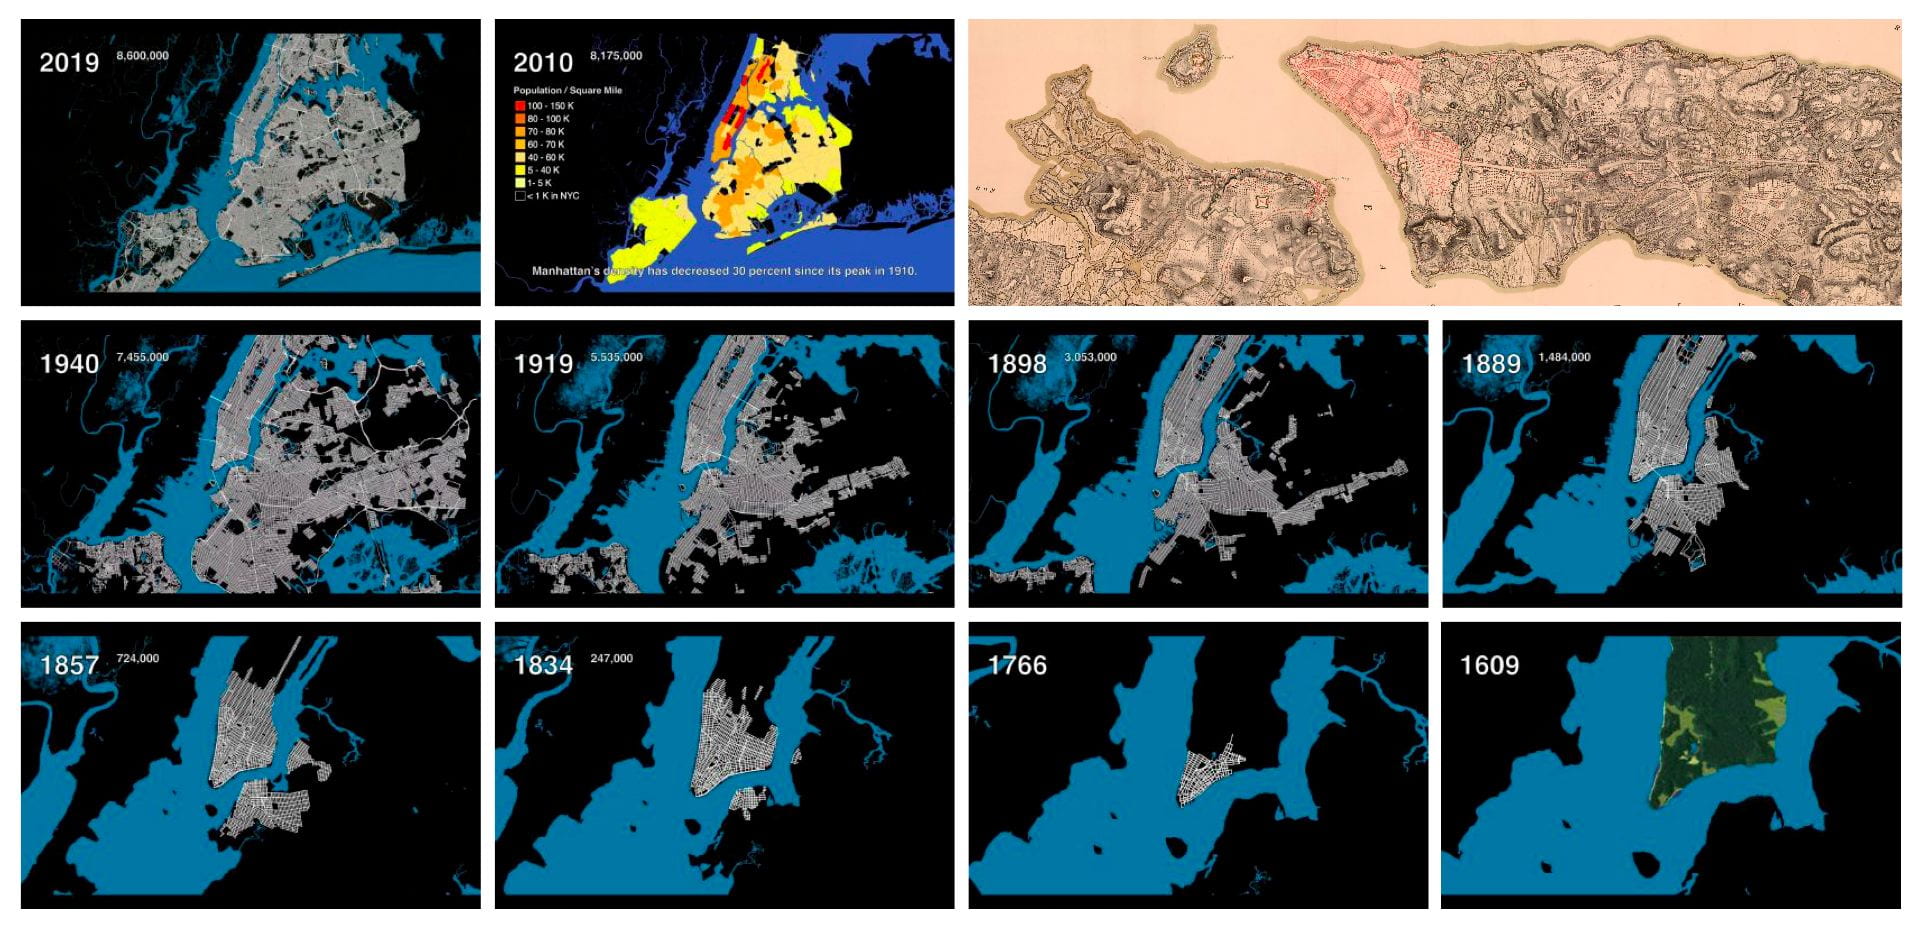
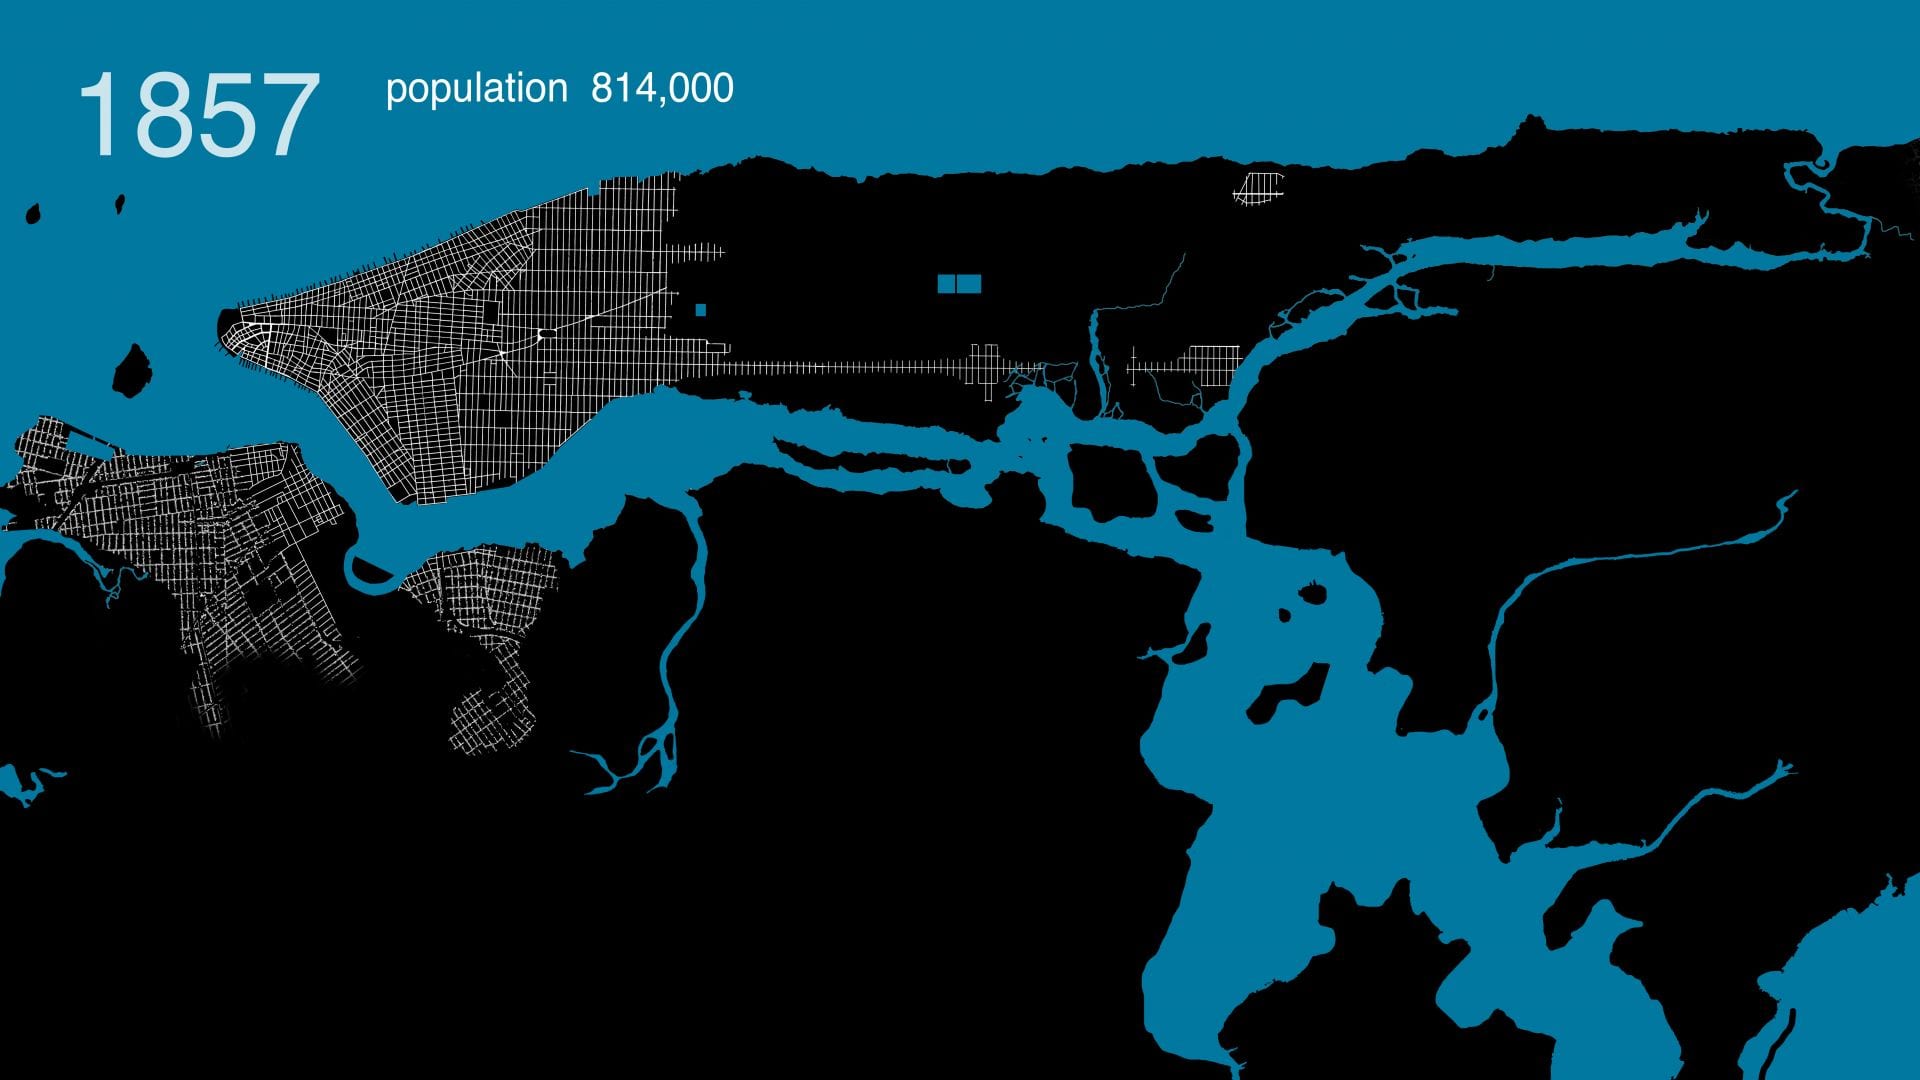
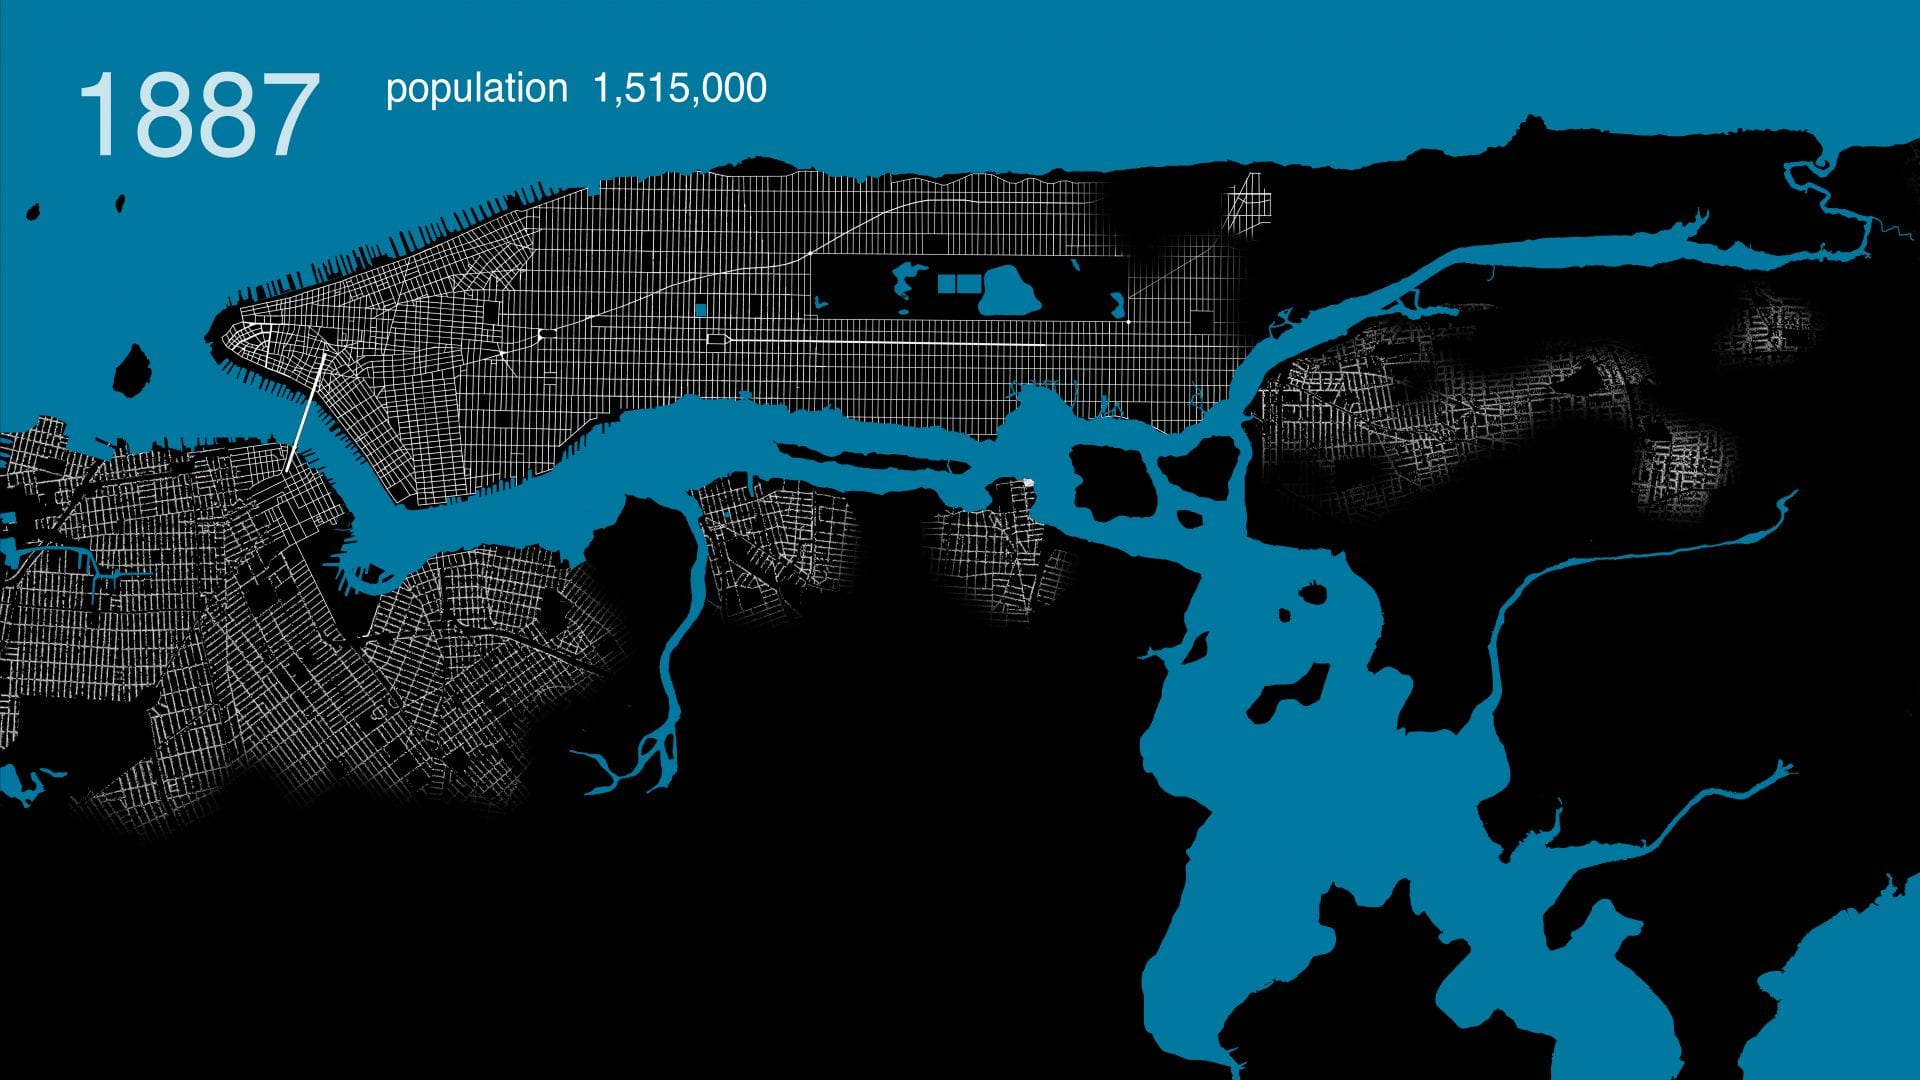
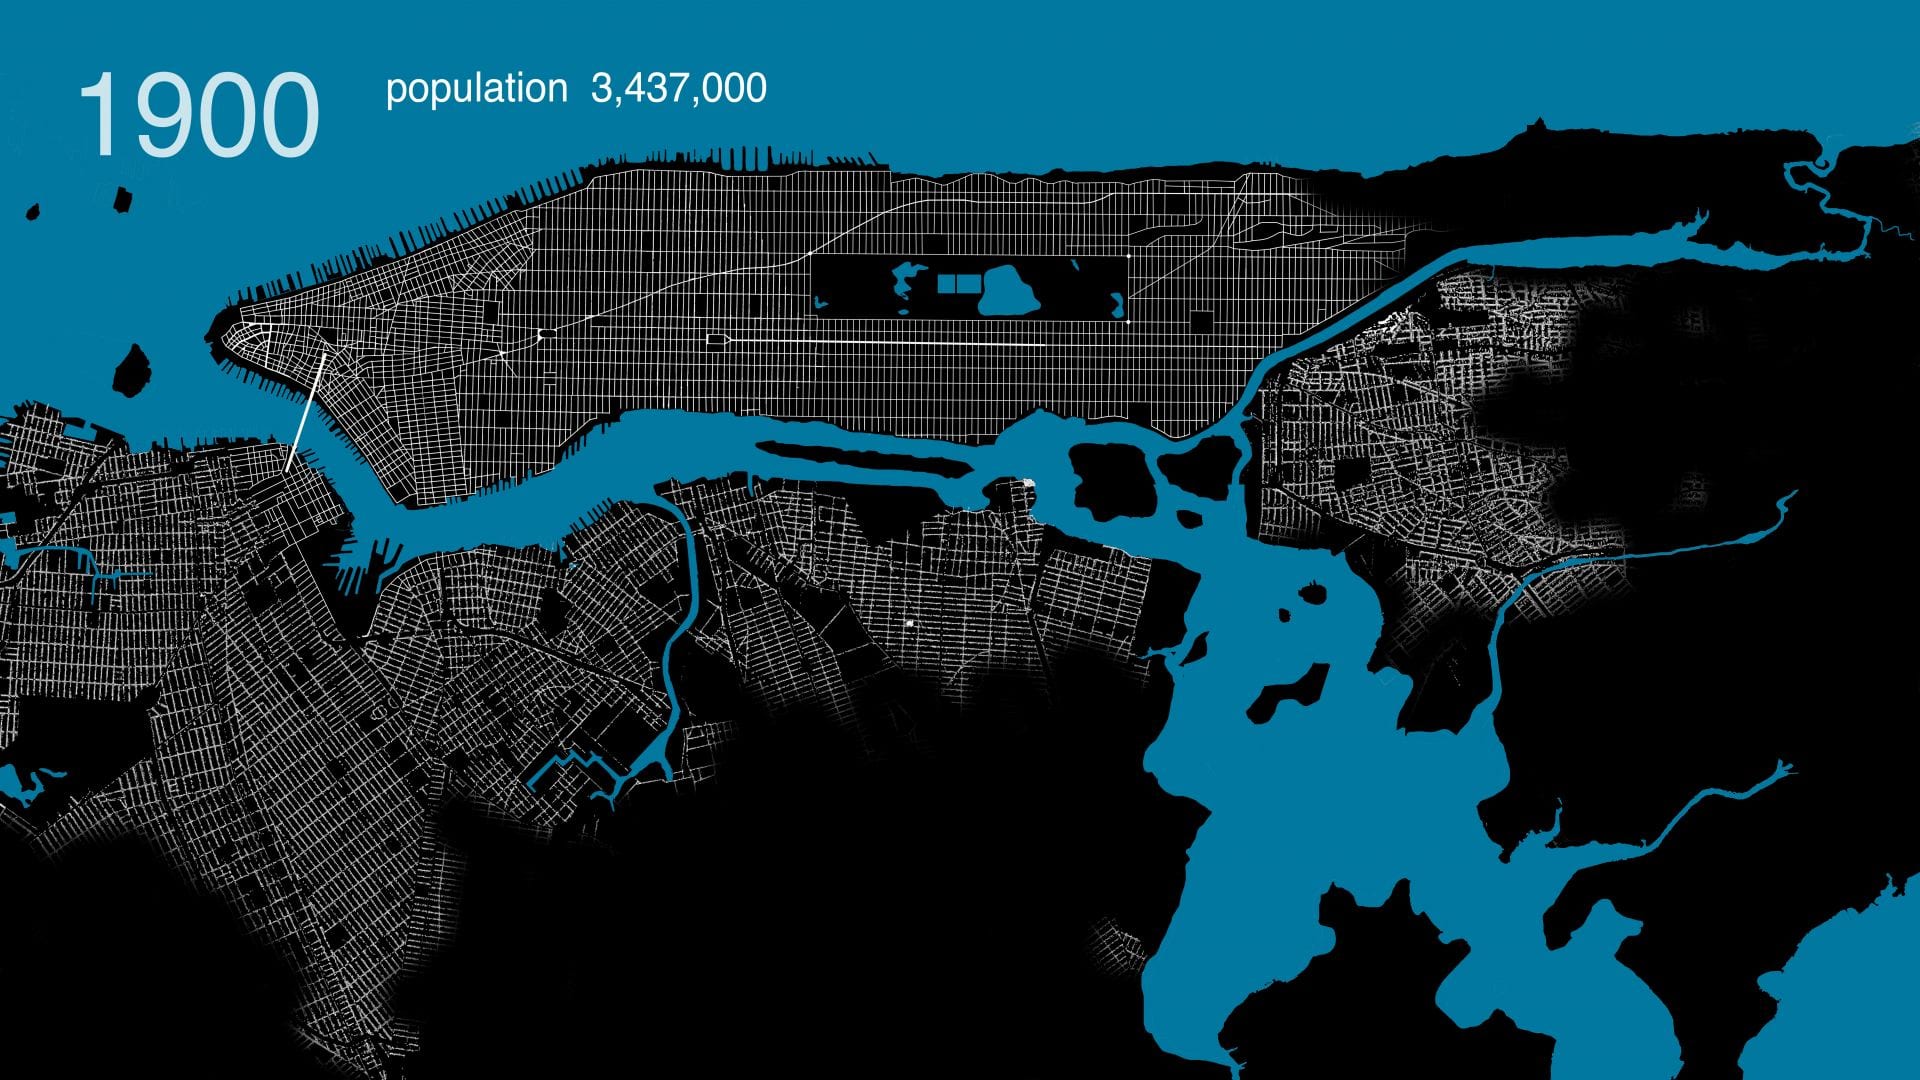
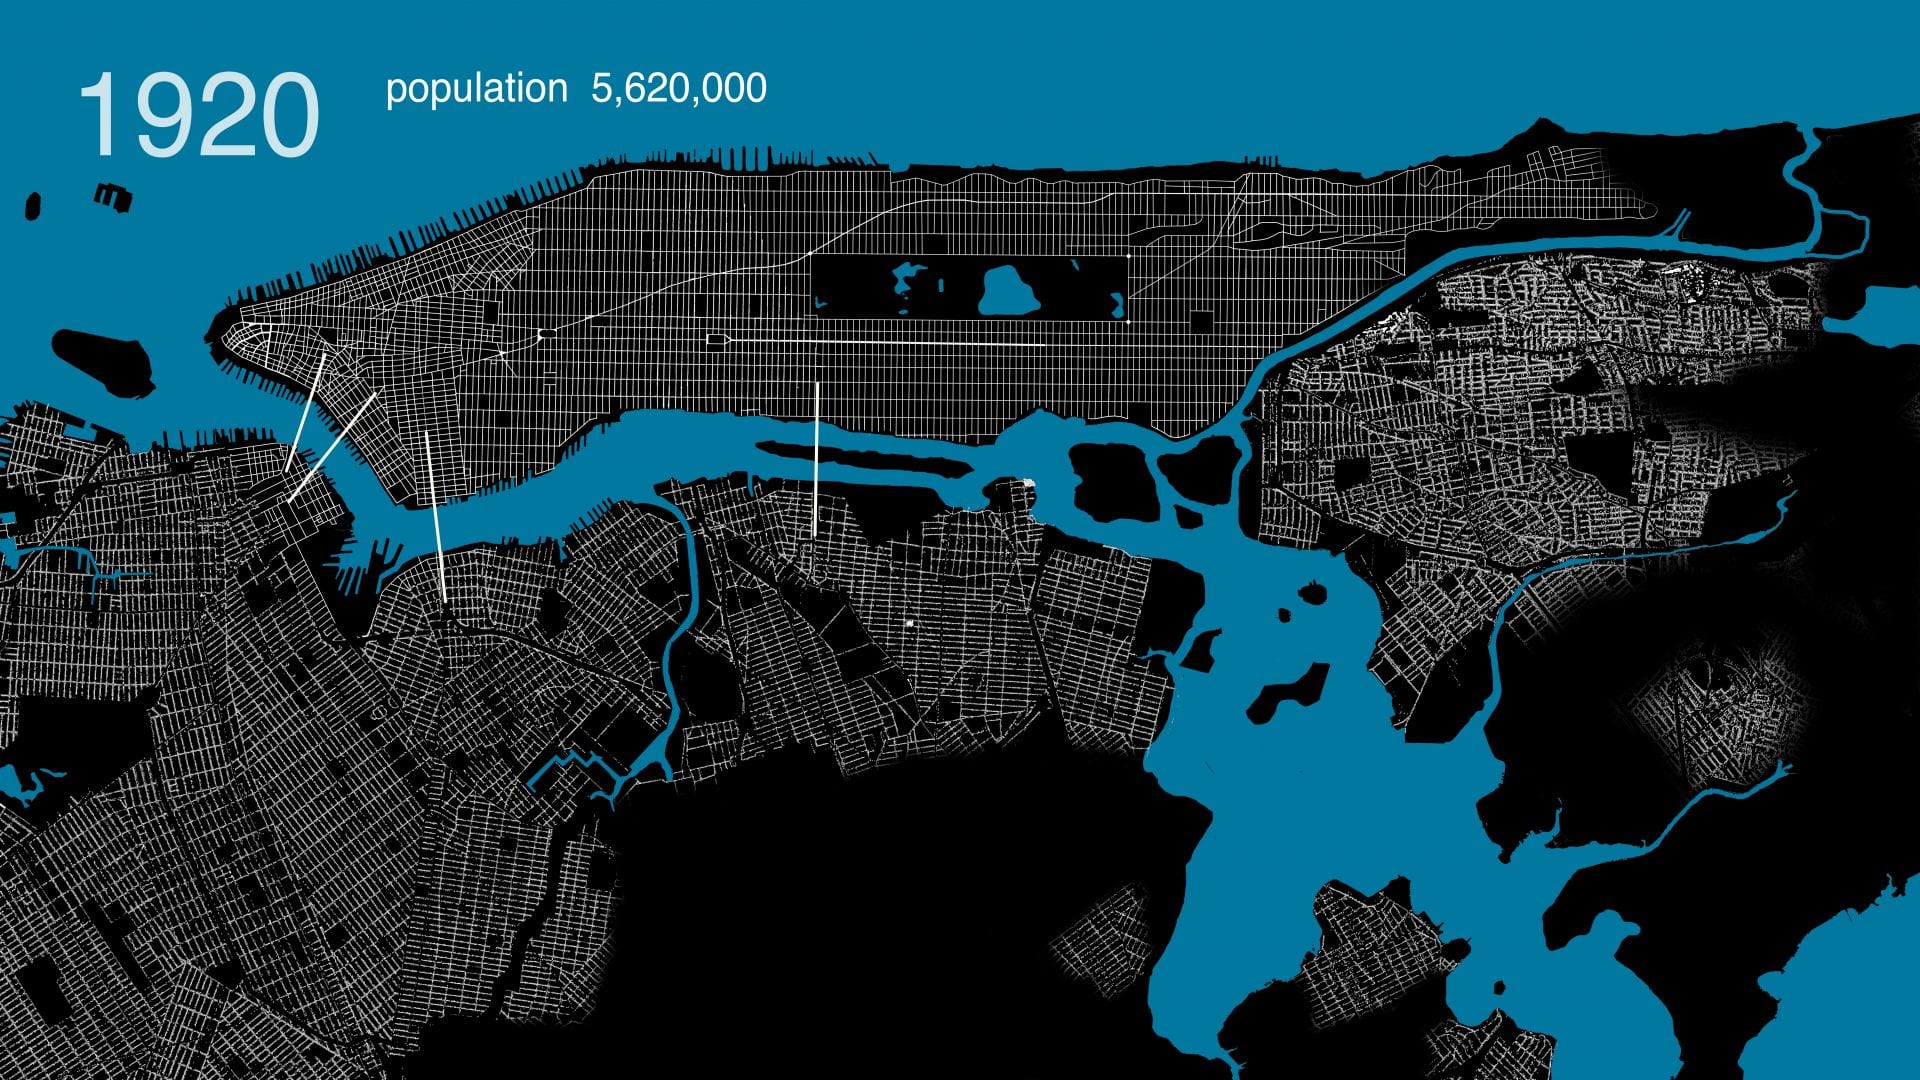
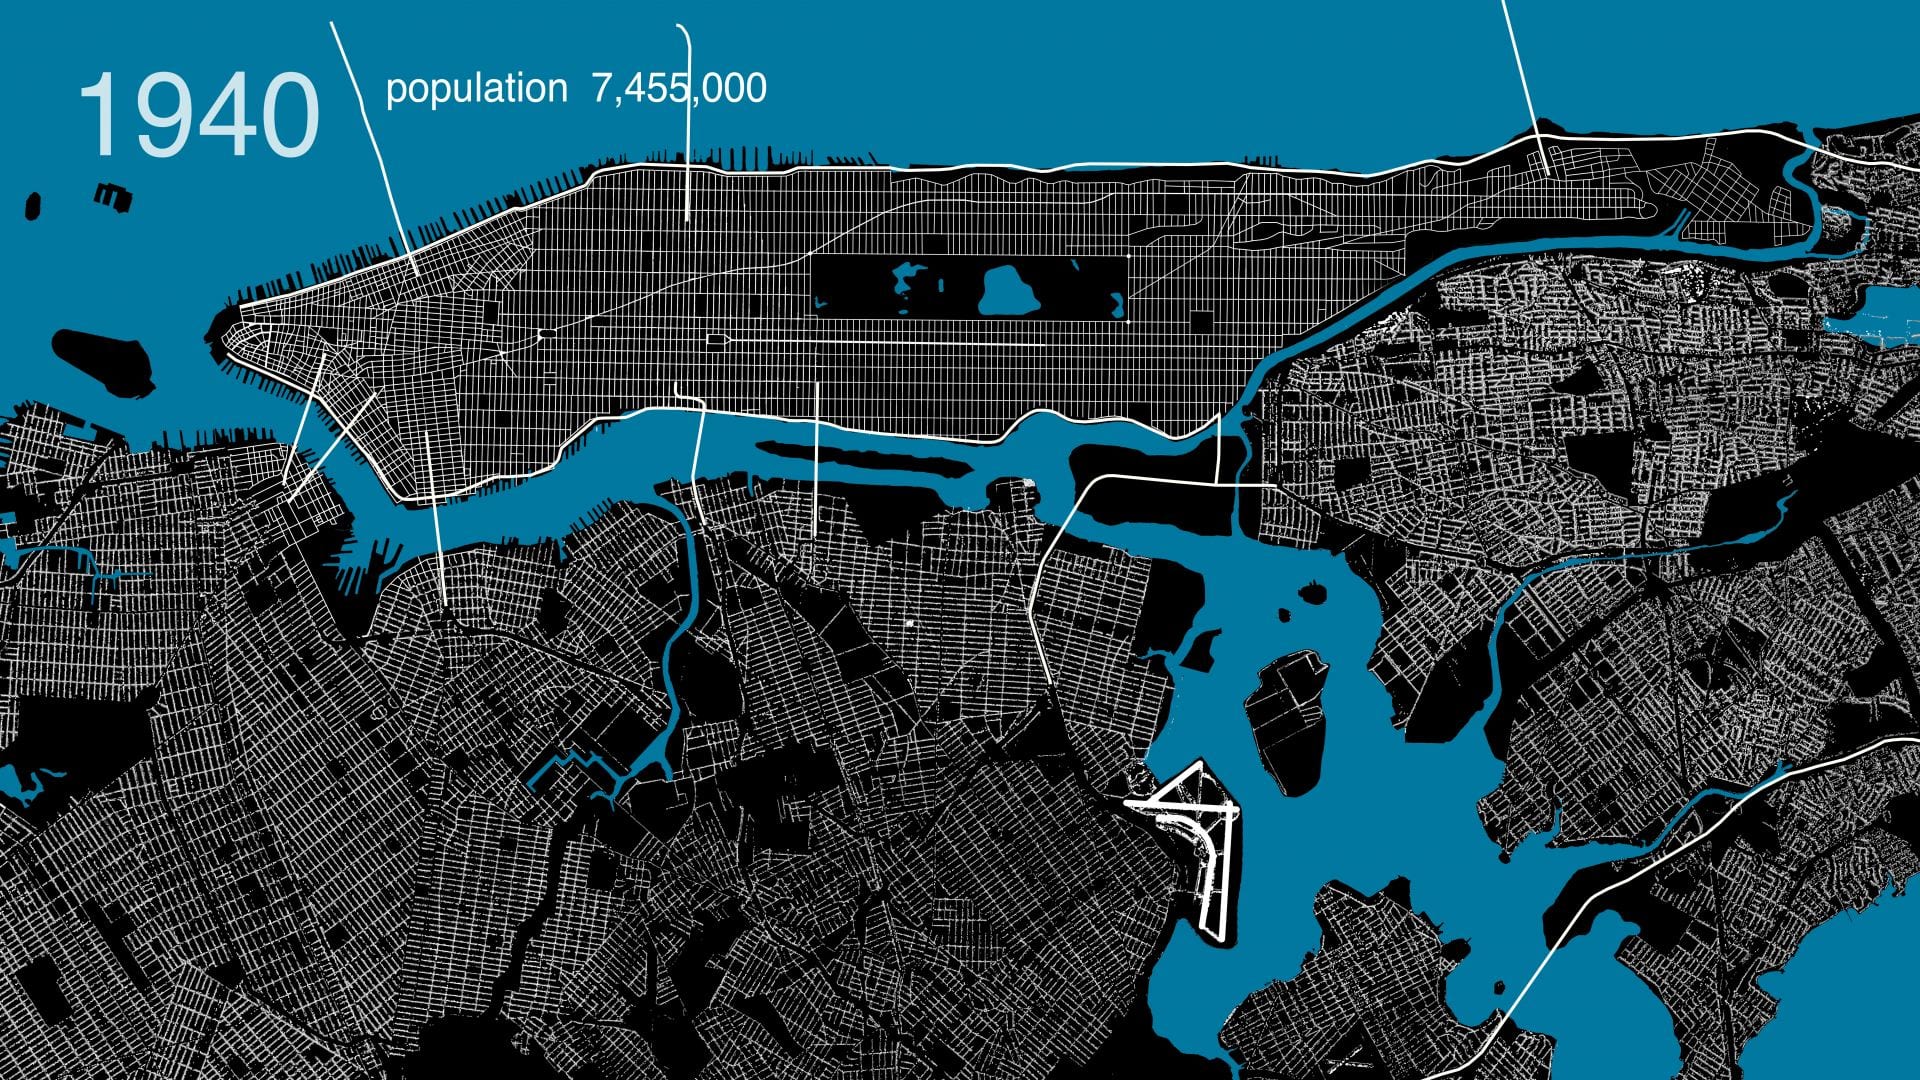
Here Grows New York visually animates the development of this city’s street grid and environment from 1609 to the present day, using geo-referenced road network data, historic maps, and geological surveys. The resulting short film presents a series of “cartographic snapshots” of the built-up environment at intervals of every 20 to 30 years in history. This process highlights the organic spurts of growth and movement that typify New York’s and most cities’ development through time. The result is an abstract representation of urbanism.
Featured in:
- Wikipedia
- Laughing Squid March 12, 2019
- Viewing NYC March 14
- silive.com March 14
- Open Culture April 17
- Columbia Data Science Institute May 1
- Library of Congress Blog May 2
- Kottke.org May 6
- NYNJ.com May 13
- 6sqft May 13
- UK Daily Mail August 28
- LangweileDich.net June 11, 2020
- New Amsterdam History Center December 1, 2020
- Bunk History July 2021
- Camden Town, 2023 textbook by Westermann Group
- Inspired by Cambridge University’s London Evolution Animation and this map of Barcelona
2. The Interactive Map
The results of this animation are transformed into this fully interactive map:
3. Research Method
Several hundred maps in the digital archives of the New York Public Library and Library of Congress were analyzed to assemble this film. About 25 of these maps were then selected, downloaded, merged, stretched, and warped in a single document to align with each other. This provided a consistent scale and allowed easier comparison of differences between maps of different date. As the source files were all in different colors, scales, and designs, we created a single base map with unified graphics. The redrawing not only permits correcting errors in less accurate old maps but also provides a graphic representation that is consistent over time. This coherence allows the rate and trends in urban growth to be read more easily and compared between eras.
Click here to read the research methodology and list of maps consulted.
Or watch the video tutorial below of the workflow and software behind the animation
4. Conclusions and Analysis
This data visualization informs our analysis of the history of the New York City grid. This analysis reflects on the question: What can the built environment of Manhattan’s streets reflect about the evolving social and economic priorities of city planners and leaders? The long phases of urban growth and shifting transportation modes created distinctive road networks in Manhattan. The predominance of different forms of transport during each era also prompted changes to the location and dimensions of streets in response. Manhattan illustrates the evolution of these road networks over four centuries of near continuous growth. A plot can describe a street grid, as well as its builders’ story. This paper aims to tell this second plot, a story of urbanism.
5. Credits and Appendix
This project would not have been possible without the support, mentorship, and patience of my parents, Anne Mabry and Zemin Zemin Zhang. Nor would this project have been possible without the historical expertise of Columbia University professors Kenneth T. Jackson (History Department) and Gergely Baics (Urban Studies). Thanks is also extended to those who reviewed and critiqued this project in its early stages, including Chris Kok, Wright Kennedy, Dan Miller, and the Center for Spatial Research at Columbia’s Department of History. Most importantly, I thank my dog ChoiChoi.

Anyone may reuse or republish this content, so long as credit is provided with the link back to this page. If you email mylesz@umich.edu, I will gladly send along the graphics, maps, and source files associated.
") 1609 - Pre-development Topography
1609 - Pre-development Topography


Hello Myles,
I enjoyed your wonderful animated New York development. Worthwhile watching and a good example for how to use information. Thank you for sharing this.
Andreas
Hello Andreas,
Thank you for your kind words! I’m delighted you enjoyed watching. You’re welcome to reuse this research and data. Cheers.
– MZ
Well, I loved this video. It was very animated. We could see a lot of New York. I will subscribe, Myles.
(Well I’m Portuguese, and I am in school.)
This is an exceptional project that demonstrates so clearly the evolution of a great city over centuries. I will use this to inform my classes about the process of development. The technology that allows this is fantastic, but your creativity and curiosity are the true marvels.
Beautifully done, Myles! I loved the subtle score, the superb quotations, and the overall pacing, along with the state-of-the-art cartography.
This is amazing I would love to see a video about the railroad systems and Indianapolis. Definitely will be checking your videos out for now on.
Quite interesting! The animation compels me to research the vast stories and history of NYC through this time to enrich and fill in the human element that is the backbone to the maps.
Thanks.
Nicely done! And also like soundtrack. But a couple of questions/thoughts:
For the 1609-1624 segment, you’re using the Mannahatta Project/Wildlife Conservation Society map from Dr. Eric Sanderson and Markley Boyer. Yet I see no credit given to them.
Your subtitle for 1624 says: “Dutch traders first settle the region.” This is a little ambiguous. Traders don’t “settle,” they trade. In fact, the first settlers of 1624-1625 were French-speaking Walloons (a part of today’s Belgium) but under the control of the Dutch West India Company, i.e., the “Dutch” or more accurately: the Republic of the Seven United Netherlands. And, interestingly, the man who “purchased Manhattan for $24 worth of glass beads” (Pieter Minuit) in 1626 was also a Walloon, working as the Dutch colonial Director-General of New Netherland, which included New Amsterdam or later: New York.
Harald Johnson
Author, NEW YORK 1609: A Novel
who did the soundscore?
“Cities” by the band Maserati: https://www.youtube.com/watch?v=M138WvHKSFo