The history of New Jersey suburbs as told through five data visualizations
.
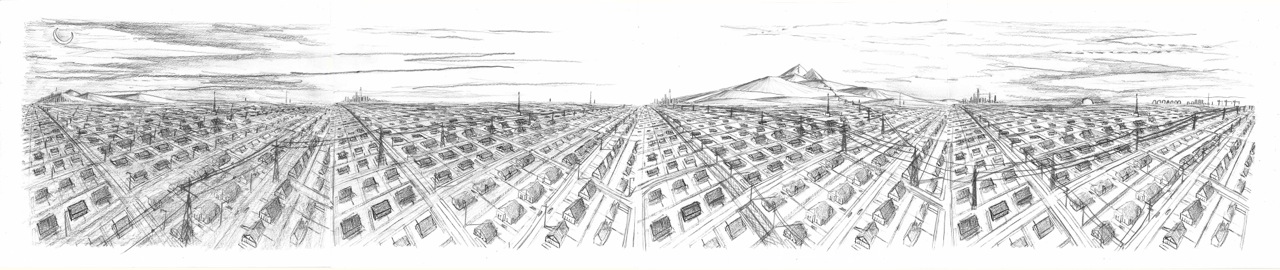
View of the city from the suburbs, author’s panoramic drawing of suburbs with urban skyline in the distance
“The state of New Jersey offers an ideal setting in which to analyze the distinctive residential landscape of mass suburbia. [….] In time, 70 percent of the state’s total land area would qualify as suburban, so that by the turn of the twenty-first century New Jersey and Connecticut shared the distinction of being the nation’s most suburbanized states.”
– Lizabeth Cohen, “Residence: Inequality in Mass Suburbia”
in A Consumer’s Republic, p. 197.
Northern New Jersey has long been central to the history of America’s suburban growth. From America’s oldest suburban developments to its most homogeneous to its most diverse, New Jersey’s 565 municipalities span the full portfolio of suburban living arrangements. New Jersey is unique in the sheer number of municipalities, each with its own elected leaders, school district, police, fire, and land use policies. As a result of inefficient and often duplicate public services in competing suburbs, New Jersey has some of the highest property taxes and cost of living in the country. This problem is not unique to New Jersey; it affects the country at large in dozens of other places. So the story of New Jersey makes for a powerful and revealing case study of larger trends in American suburban history.
This analysis examines New Jersey census data from 1940 to 2010. It is not the end point or a full analysis. Instead, each of these data visualizations plots a direction for future research. Telling history through maps and data reveals the history of a larger region and country, in ways that granular analysis of individual places cannot.
Table of Contents:
- Population loss vs. gain
- Link between population densities and suburban growth
- Municipal annexation and political fragmentation
- The municipal fabric before suburban growth
- Back to the City?
Method
With data from the US Census Bureau, I extracted details on the population of every New Jersey municipality from 1940 to 2010, the period of greatest suburban growth. With spatial data on municipal boundaries from the NJ Office of GIS, I plotted the census data onto the map of municipal boundaries. This allowed me to see spatial patterns and to produce heat maps of population change over time. The spatial data also revealed the surface area of each municipality, which allowed me to calculate the historical population density of each municipality as a function of municipal population divided by municipal surface area. You can browse all the data visualizations or download the open source data here from Tableau. These data visualizations represent analysis of about 13,560 data points for 565 municipalities over eight censuses.
1. Population loss vs. gain
The map below reveals that every urban area in New Jersey lost population from 1950 to 2000. Meanwhile, the majority of rural areas gained population to become commuter suburbs. Wedged between the metropolises of New York City with 8.4 million residents and Philadelphia with 1.6 million, New Jersey has no cities with over 300,000 people. Thousands of white-collar workers live in the state’s suburbs and commute out of state for work, at least a quarter million people per weekday pre-pandemic. New Jersey is therefore more of a bedroom community than any other American state. The map below shows the scale of suburban population growth with areas that gained population colored in green. The darker the shade of green the greater the population gain from 1950 to 2000. At the same time, almost every major New Jersey city was losing people. The darker the shade of red the greater the population loss. This map produces two parallel stories of urban decline vs. suburban growth.
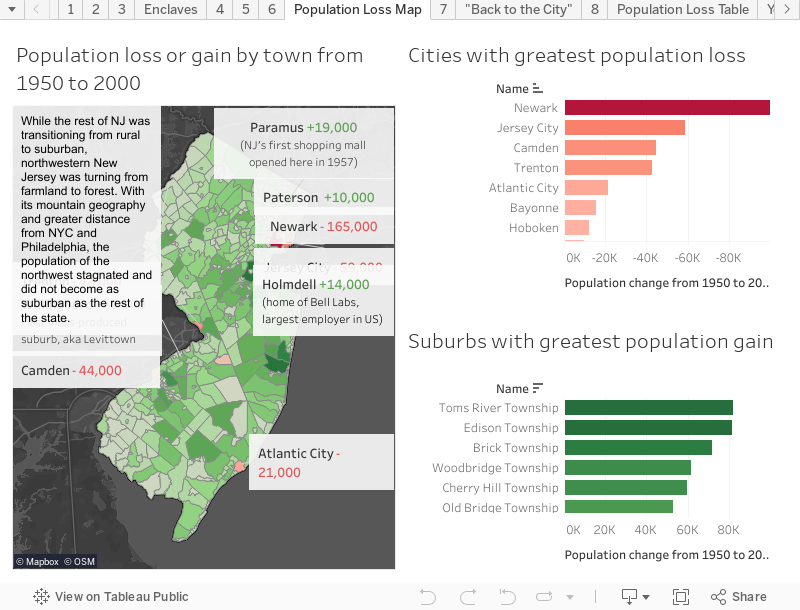
Hover over data points to reveal details.
Unsurprisingly, the rural parts of the state with the farthest commuting distance from New York City and Philadelphia experienced the least population growth. Instead of becoming suburbs, the farmlands in the northwestern corner of the state that once provisioned New York City markets with food reverted to forest during the twentieth century. Transportation improvements like Eisenhower’s interstate highways made it cheaper to grow foods in the distant but fertile lands of the Midwest and South and to ship those goods to New Jersey than to grow those foods locally near consumers. At the same time, Central Jersey’s richest and most fertile farmland – along the line of the Northeast Corridor between New York City and Philadelphia – became suburbs. The farms here were pushed farther away, such that, by the end of the twentieth century, New York City food is supplied from thousands of miles away. New Jersey’s nickname of the “Garden State” once referred to the state’s rich agriculture and farms. Today, this name has an unintentional double meaning, as the only gardens left are the green suburban lawns in the ever-expanding crabgrass frontier.
Conclusion one: Despite its proximity to and reliance on major cities, New Jersey’s geography and population densities are almost entirely suburban.
2. Link between population densities and suburban growth
From 1950 to 2000, a total of 52 New Jersey cities lost about one million White residents and gained about 400,000 African Americans and Hispanics. As Whites moved out, other ethnic groups moved in. The flight of urban Whites to the suburbs happened across twentieth-century America.
In contrast to the population decline of New Jersey cities, a total of 513 towns and boroughs gained around four million people from 1950 to 2000. New Jersey’s suburban population growth was through a combination of Whites arriving from cities, Whites arriving from other states, and natural birth rates during the “baby boomer” generation. The average population density per square mile of places that lost people in this period was 6,400, while places that gained people contained on average 2,100 people per square mile. Population loss systematically occurred in urban places with high population densities in 1950. Population gain systematically occurred in rural places with low population densities in 1950. In other words, sprawl. Almost all of New Jersey’s population and economic growth in the second half of the twentieth century was concentrated in lower-density suburban areas, often at the expense of the cities where wealth was traditionally concentrated.
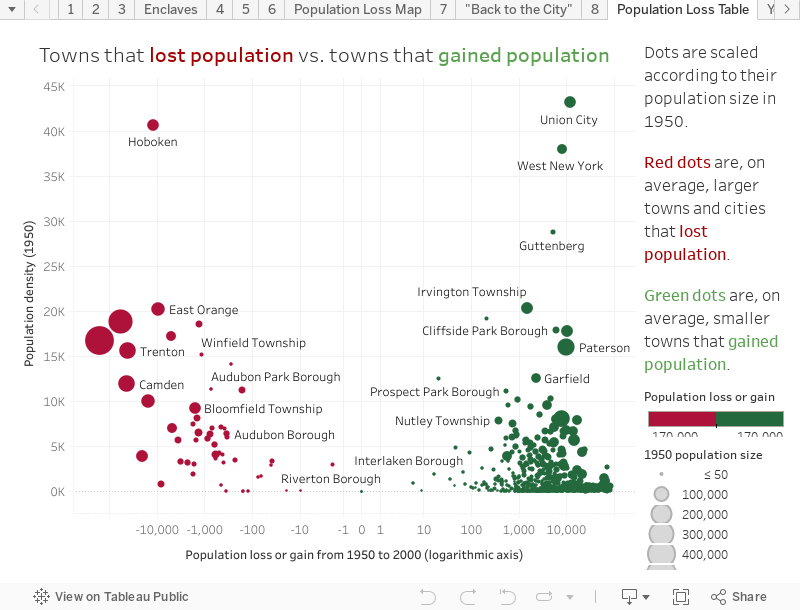
Hover over data points to reveal details.
Horizontal axis ranks places by population loss or gain (logarithmic scale). Vertical axis ranks places by population density in 1950 (linear scale). Dots are sized according to population in 1950. Red dots are, on average, larger cities that lost population. Green dots are, on average, smaller suburbs that gained population. All the largest cities with the higher population densities, that is, all the largest dots (with the exception of Union City) lost population to neighboring suburbs. The higher the population density, the greater the magnitude of twentieth-century population loss due to decentralization. Notice how high-density cities with large populations form one red cluster, while low-density suburbs with small populations form a separate green cluster.
Conclusion two: The state has migrated from a centralized economy centered on cities and urban life to a decentralized and suburban economy. This movement has consequently drained cities of people and economic energy.
3. Municipal annexation and political fragmentation
In the late nineteenth and early twentieth centuries, dozens of American municipalities were consolidated into larger urban areas. For instance, the 1898 consolidation of Manhattan, Bronx, Brooklyn, and dozens of small farming hamlets in present-day Staten Island and Queens produced the contemporary city limits of New York City. This 300 square mile area allowed for New York City’s urban expansion, the elimination of otherwise duplicate municipal services, and the central organization of rapid transit, zoning, and land use policies. The metropolitan-scale vision and infrastructure projects of Robert Moses would have been impossible otherwise.
Municipal consolidation never went as far in New Jersey, with a few exceptions. The state’s second largest city of Jersey City with a population of 266,000 (2018) was formed in 1870 by merging the small towns of Hudson City, Bergen City, and Greenville. The state’s largest city of Newark with a population of 282,000 (2018) was reformed in 1905 by annexing neighboring Vailsburg. Yet, as a whole, the state’s geography remained divided with its largest cities unable to increase in population or expand their political power through municipal annexation. Throughout much of the nineteenth century, and even before the era of rapid suburban growth, the trend in New Jersey was already toward decentralization with the subdivision of larger towns into ever-smaller units and school districts. For instance, if Newark covered the same surface area in 2019 as it did in 1790, it would be the eighteenth largest city in the US in 2019 with an estimated population of 800,000, ahead of Denver and behind Seattle. Instead, Newark is the country’s third oldest city behind Boston and New York, but it is only the 73rd largest in population.
Suburban towns that are economically reliant on Newark but are politically separate from Newark straddle the city on all sides, isolating a majority-Black community in the inner city from the prosperity of surrounding suburbs. As a result, most of the economic energy generated from urban centers like Newark and political centers like Trenton is drained off through tax revenues in neighboring towns, where white-collar workers employed in these cities actually live. Had municipal annexation succeeded in New Jersey, tax revenue from peripheral towns could be directed to urban centers where that money is needed most and where it came from, after all. In contrast to cities in most other developed countries, most American cities are therefore concentrations of poverty ringed by wealthier areas. As a related consequence, New Jersey cities face chronic and decades-long challenges balancing their municipal budgets and must rely on charity from the state legislature in the form of grants.
Cities like Newark rank higher in their regional and economic influence than their small populations and limited surface area would lead one to believe. Newark is the state’s economic, shipping, rail, airport, and higher education hub, with more of these key industries concentrated in Newark than in any other New Jersey city. But suburban policies resistant to centralized government and municipal annexation have thwarted Newark’s deserved political influence. Kenneth Jackson describes consolidation in Crabgrass Frontier: “Without exception, the adjustment of local boundaries has been the dominant method of population growth in every American city of consequence. [….] Viewed another way, if annexation had not been successful in the nineteenth century, many large cities would have been surrounded by suburbs even before the Civil War.”
Unfortunately, while the rest of the country was moving toward annexation in the nineteenth century, New Jersey experienced municipal fragmentation. For instance, the more urban and higher density borough of Metuchen is entirely surrounded by the less urban and lower density town of Edison. At one time, these two places were part of a single and larger township called Woodbridge. As railroads began linking city and country in the mid nineteenth century, urban residents started moving to Woodbridge and formed an early commuter suburb. The existing residents of Woodbridge were largely Democrat farmers, while the new commuters were largely Republican businessmen. The farmers were content with few municipal services, while the new commuters demanded paved roads, water supply, sewers, and street lighting. In the resulting conflict between rural and suburban, the small suburb of Metuchen clustered around its commuter train station broke off from the larger municipality. At 2.85 square miles, Metuchen is the size of postage stamp on the map of New Jersey, while more suburban Edison is like a doughnut that surrounds Metuchen on all sides.
There are at least thirty towns like Metuchen across the state, known as “doughnut towns” because one municipality encircles another. The average size of these towns is less than three square miles. This unique quirk of New Jersey geography hints at the longstanding conflict between rural and suburban. As the state evolved from a land of homesteads into a sea of platted suburban home lots, existing farmers resented their state’s changing geography and urbanizing economy. The table below outlines these municipal enclaves.
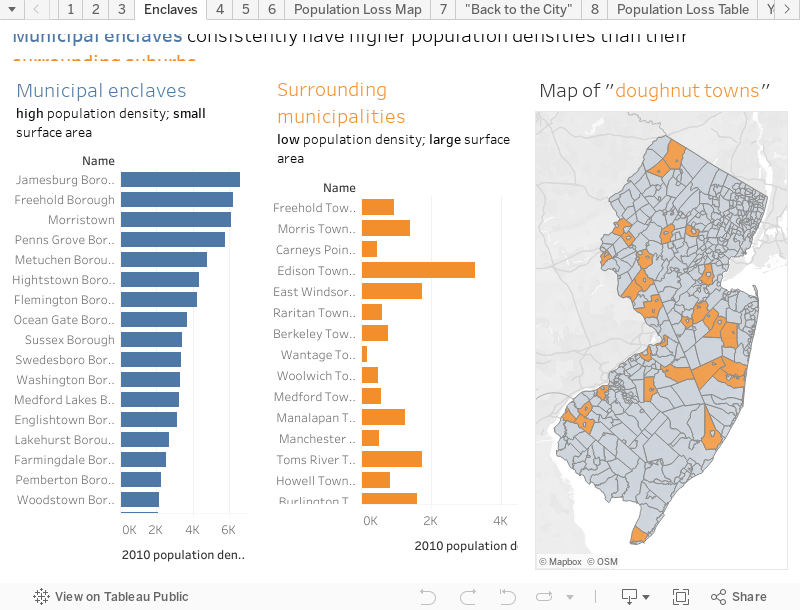
Hover over data points to reveal details.
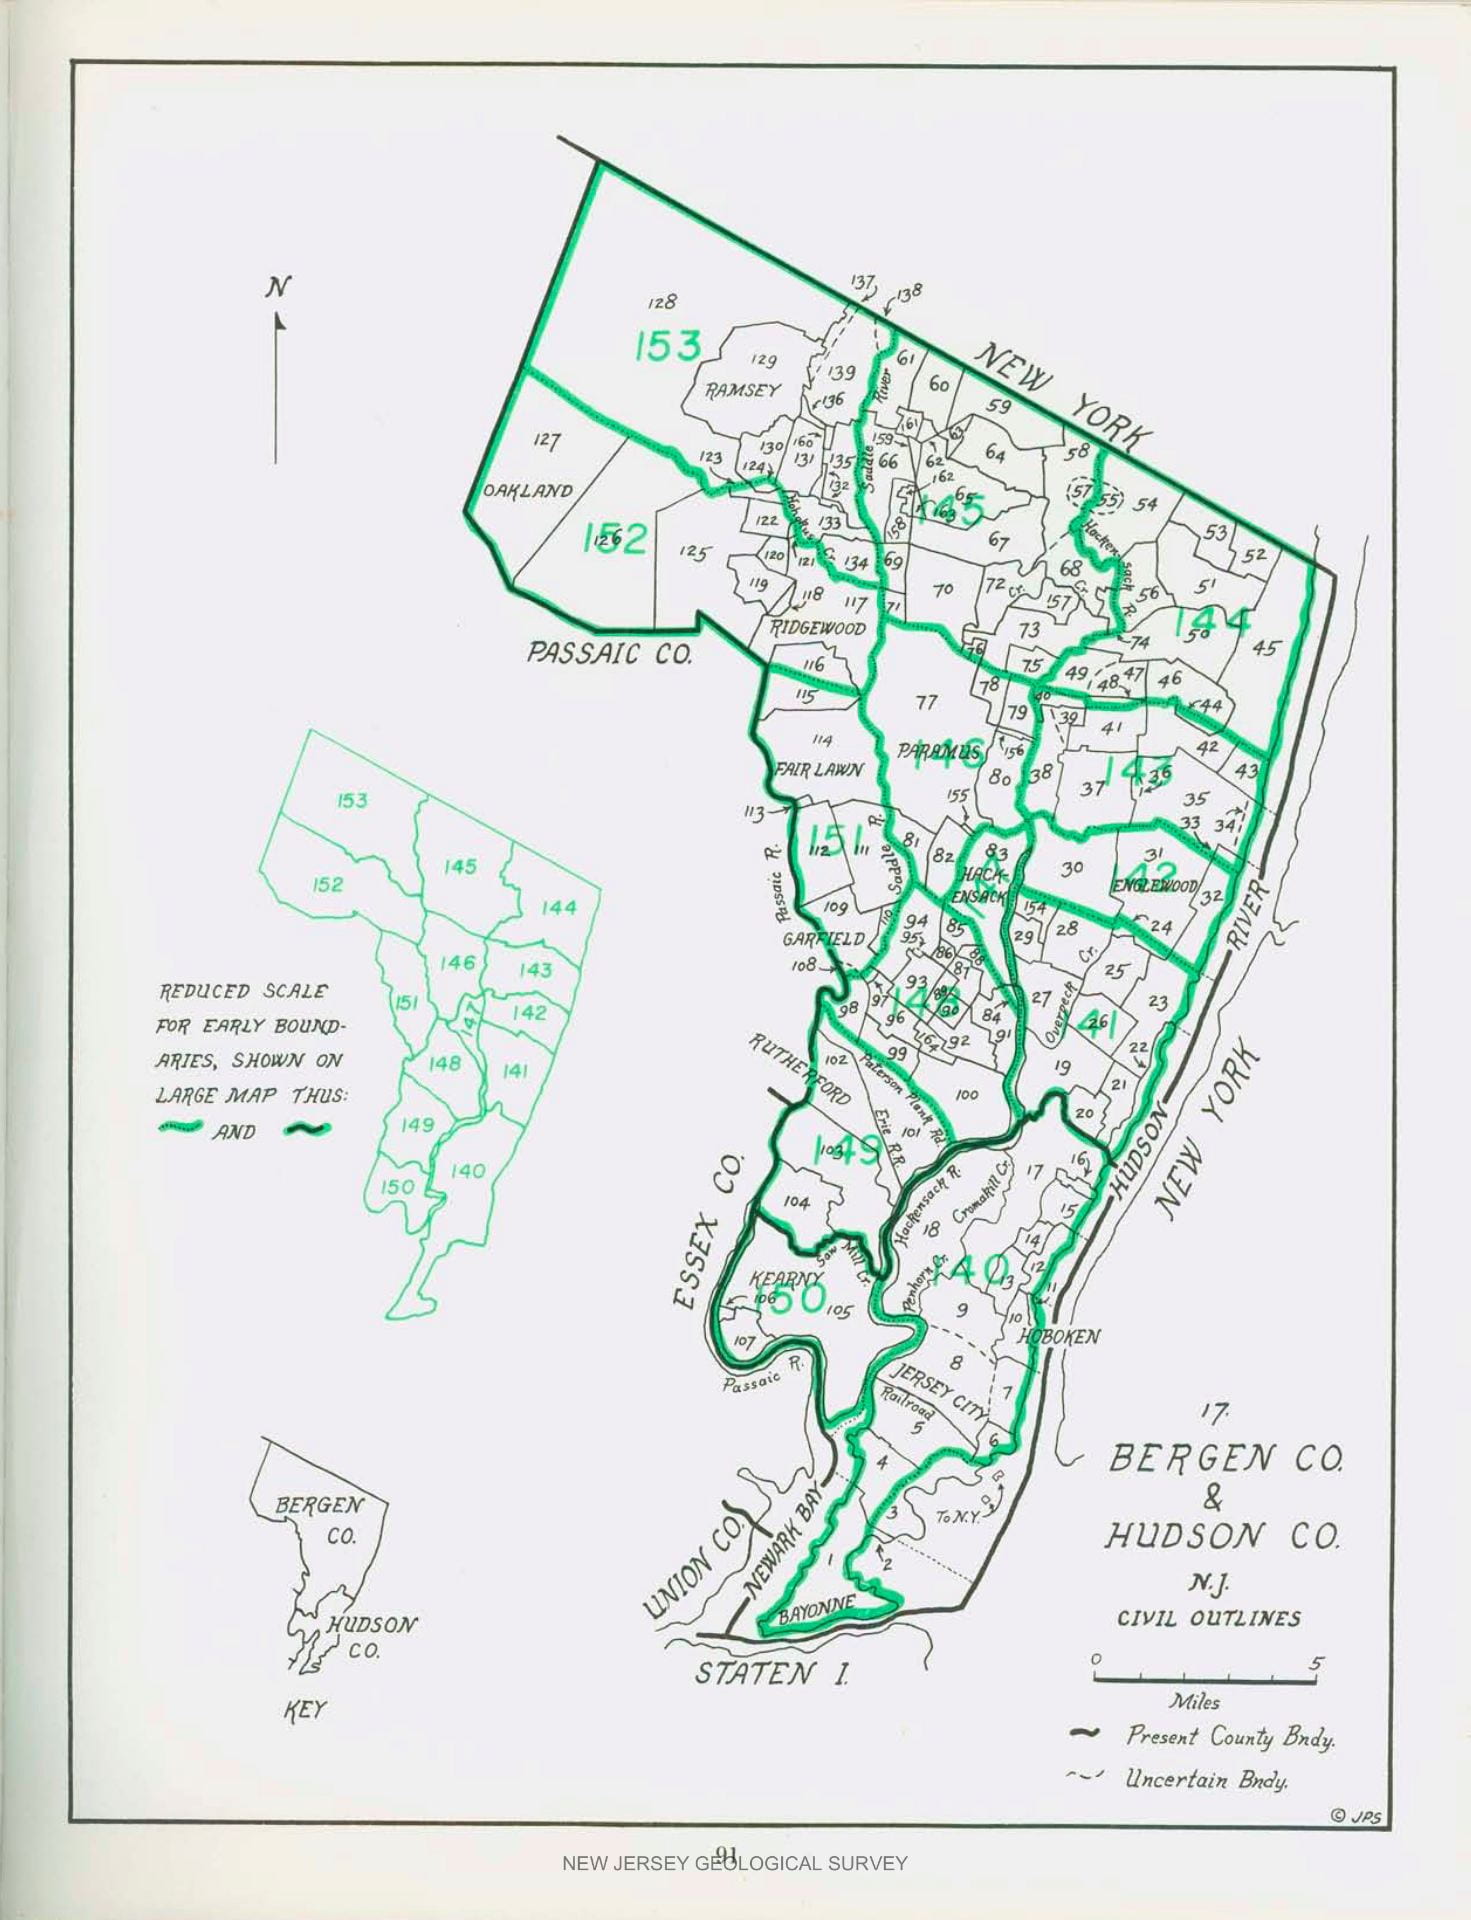
The county maps from John P. Snyder’s History of New Jersey’s Civil Boundaries are revealing. They illustrate the division of New Jersey into ever-smaller municipal units. The map below shows, for instance, the original vs. contemporary municipal boundaries in Hudson and Bergen County along the Hudson River. Colored in green are original boundaries vs. the present-day ones in black.
In many other states, rural farmers went along with the newly arrived residents of commuter suburbs and accepted greater investment in municipal services. In New Jersey, rural residents did not; they insisted on autonomy, independence, and decentralized government. Hence, New Jersey splintered into so many hundreds of places with their own strong, separate, and long-established civic identities. As a result, cities like Chicago and New York cover enough surface area that an African American or Hispanic family can move to a better neighborhood nearby without being in a new suburb. Yet, New Jersey municipalities are so fragmented that a change of address almost inevitably means a change of town with new laws, new taxes, a new civic identity, and a new school district. Recent debates in New York City have centered on desegregating public schools by sending poor and minority students to public schools in better and majority White neighborhoods. In New York City, this is possible because eight million people share a unified school district. The same, unfortunately, is impossible in New Jersey. In this way, municipal fragmentation emphasizes local control but hinders political unity and coordinated planning decisions.
Conclusion three: Despite having an economy centralized around urban areas, and despite being part of a megalopolis of cities on the Northeast Corridor, New Jersey is politically fragmented and still sees its political identity as rural and anti-urban.
4. The municipal fabric before suburban growth
New Jersey’s municipal framework for suburban growth was laid out early, even centuries before its suburbs grew. The earliest settlers and colonists in America believed in local control of government. In the New England farming hamlet of colonial days, all eligible White male taxpaying citizens participated in direct democracy. These voters were tasked with passing new laws, improving roads, and maintaining common lands. Over 200 years of early American growth, most of the land within the eight states of New Hampshire, Vermont, Massachusetts, Rhode Island, Connecticut, New York, Pennsylvania, and New Jersey were divided into “incorporated communities.” This produced hundreds of New England towns with relative autonomy from higher authorities.
By contrast, the rest of America followed a different development path from the original thirteen British colonies and contained more “unincorporated communities” – that is land and people not part of a local and direct democracy. People in unincorporated communities are still full citizens with voting rights, but the management of their municipal services, like roads and water, is often tasked to a larger and more distant power, like the county government. Several unincorporated villages might also be grouped as part of a larger municipality.
New Jersey’s belief in local control and direct democracy resulted in the early incorporation of municipalities, and a likely stronger sense of local identity than in other regions. The chart below shows that most of New Jersey’s municipalities were laid out in two sweeps. In 1798, 104 rural and farming towns were incorporated as part of the “Township Act of 1798.” Decades later, new residents in the state’s growing commuter suburbs like Metuchen demanded more municipal services like water, fire, and sewer. When residents of the existing farming areas objected, dozens of boroughs broke away to form bedroom communities in the second sweep of new municipal incorporations. The peak year was 1894 when 36 new towns and boroughs were created along the Bergen County commuter rail lines linking northern New Jersey to New York City. However, during the high period of suburban growth from the 1930s to the present-day when New Jersey gained 4.8 million people, a mere twelve new places were incorporated. In other words, the political geography of New Jersey suburbs was laid out before the mass exodus of Americans from cities to suburbs in the twentieth century.

Conclusion four: New Jersey’s anti-urban outlook and politics are no recent or twentieth-century phenomenon. Nor did these fears of central administration come about during the suburban age. In fact, the groundwork for New Jersey’s rapid twentieth-century suburban growth was laid in the state’s earliest days.
5. Back to the City?
After 1980, thousands of Young Urban Professionals (“Yuppies”) returned from the suburbs to live in the cities. In the traditional narrative of urban history courses, the post-1980s period is represented as a rebirth of urban culture and population growth, as seen through the repeated descriptions of Newark and Detroit as Renaissance cities with their respective Renaissance Centers
However, any post-1980 urban population gain was usually not enough to counter pre-1980 population loss. While a few smaller New Jersey cities regained earlier losses from 1980 to 2010, new population growth and new housing construction were concentrated in suburban areas on the whole. New Jersey cities have grown, but they are not growing as fast as the suburbs surrounding them.
Mixed results of “back to the city”
Color key
Urban growth since 1980 does not offset earlier losses
Urban population growth since 1980 offsets earlier losses
No net population loss 1950 to 1980

This table above shows that of the twenty-four largest New Jersey cities in 1950, sixteen had a net population loss from 1950 to 1980. In the following period 1980 to 2010, only seven of these sixteen cities have seen population growth (Jersey City, Paterson, Elizabeth, Passaic, Hoboken, Perth Amboy, and Kearny). Even among these seven cities, only five of them have seen enough population growth to offset pre-1980 population losses (Paterson, Elizabeth, Passaic, Perth Amboy, and Kearny). In direct opposition to the “back to the city” trend, two of the twenty-four cities have even seen a higher rate of population loss from 1980 to 2010 than from 1950 to 1980 (East Orange and Irvington).
Viewed another way, of New Jersey’s twenty-four largest cities, only nineteen have seen an increase in the rate of population growth after 1980. But among these nineteen cities, population growth has always been from the replacement of Whites with largely lower-income immigrants from Latin America. The only two cities yuppies and middle class Whites were uniquely responsible for “turning around” through gentrification were Hoboken and Downtown Jersey City, both of which still had a net population loss from 1950 to 2010. Cities and city planners need to stop appealing to middle class Whites as the solution to their economic decline. Building more housing for yuppies will not turn these cities around because their numbers are small but lead to gentrification that will push out the people who are actually responsible for urban growth. Immigrants, more than wealthy young people with college degrees, are and always have been the drivers of urban growth in American cities.
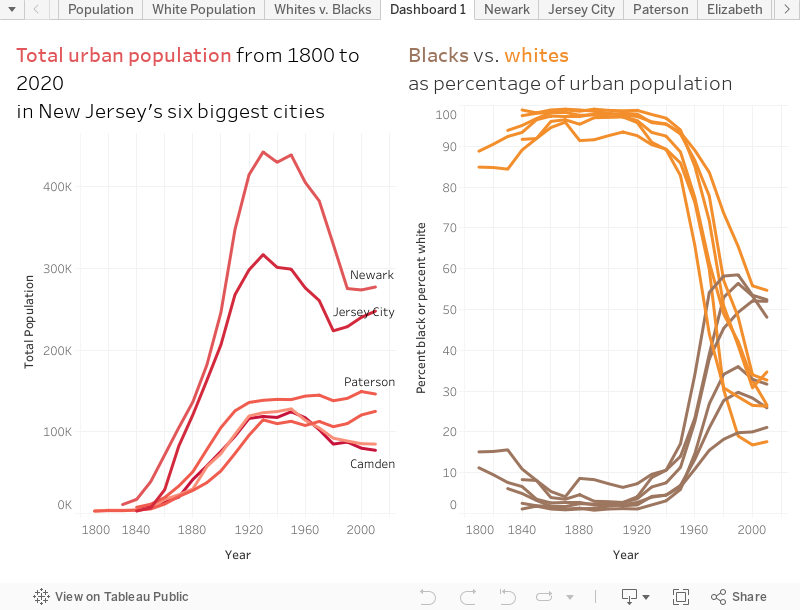
The table below shows that New Jersey’s six leading cities of Newark, Jersey City, Paterson, Elizabeth, Trenton, and Camden were always majority White until 1950-1960 when thousands of Whites fled for the suburbs while thousands of Blacks arrived with the Great Migration. The demographic trend lines have not reversed in fifty years. Only small numbers of younger and wealthier Whites have returned to cities, which is not enough to offset the continued White flight to the suburbs. In other words, the urban population of New Jersey cities has stagnated since 1980. Population gains have been small and not enough to offset continuing population loss. Because many cities have not made up for their earlier losses of people and economic power, the story of “Back to the City” can only be applied to a limited number of cities in New Jersey.
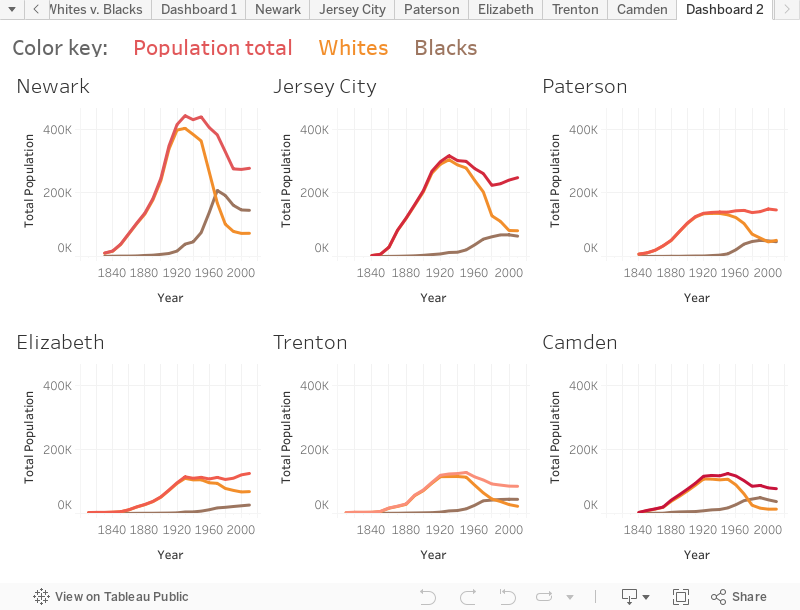
Hover over data points to reveal details. Hispanics not counted in graph because they were not measured on US census until 1970.
White population loss from 1930 to 2000: 330,047 in Newark; 222,306 in Jersey City; 93,838 in Camden; 89,514 in Paterson; 87,446 in Trenton; and 42,486 in Elizabeth
Hover over data points to reveal details. Hispanics not counted in graph because they were not measured on US census until 1970.
Taking these charts into account, Newark lost 330,000 Whites from 1930 to 2000. Since then, population loss has slowed; the city gained a mere 400 Whites from 2000 to 2010, a drop in the bucket. In the same period of 1930 to 2000, Jersey City lost 222,000 Whites, Paterson lost 90,000, Trenton lost 87,000, Camden lost 94,000, and Elizabeth lost 42,000. This brings the estimated White population loss of the state’s six leading cities to about 866,000. If including smaller places that also lost their White population, such as Union City, Clifton, Atlantic City, and Plainfield, the urban population loss comes to well over one million people. At the same time, the population replacements of African Americans and Hispanics have not been as large as the population losses of Whites. Cities across New Jersey are smaller and less central to the state’s economy than they were before the auto era.
Despite construction of new light rail systems and improvements to existing rail infrastructure, over 80% of New Jersey residents still commuted to work by car. Even in Hudson County, with excellent transit connections in Hoboken and Secaucus, 66% of commutes were still by car in 2000. New Jersey might be rich in transportation options and railroads, but most of its built environment of sprawling suburbs was not built with these “urban” transit modes in mind.
In other words, the image “Back to the City” with young people riding on bikes and public transit is more of a New York City story than it is a Trenton, Newark, Camden, or Atlantic City story. “The Garden State” was and remains suburban despite surface appearances of a renewed interest in cities. As economic historian Leah Boustan writes in Competition in the Promised Land: “Even though black in-migration to northern cities has tapered off, relative black wages have not rebounded in the North and White flight has not reversed course (despite media reports of a ‘return to the city’)” (p.9). Much of the public thinks that young people prefer to live in cities, and that the age of suburban sprawl is over in the age of the climate crisis. Yet two centuries of urban growth have failed to turn New Jersey into a state whose residents think of themselves as urban, even though it is densely populated and an integral part of greater New York City. The path of decentralization that New Jersey has followed for two centuries will guide it for decades more.
Is “Back to the City” part of a larger cultural shift, or is it a short-term illusion that the pandemic reversed when thousands of high-income young people moved back to the suburbs? If the history of New Jersey is any guide, the suburbs are alive and well and here to stay. As Robert Fishman writes in Bourgeois Utopias, a 1987 study of the origins and future of America’s suburbs:
“The ‘gentrification’ phenomenon has been highly visible yet statistically insignificant. It has done as much to displace low income city dwellers as to benefit them. The late twentieth century American environment thus shows all the signs of the two nations syndrome: one caught in an environment of poverty, cut off from the majority culture, speaking its own languages and dialects; the other an increasingly homogenized culture of affluence, more and more remote from an urban environment it finds dangerous.”
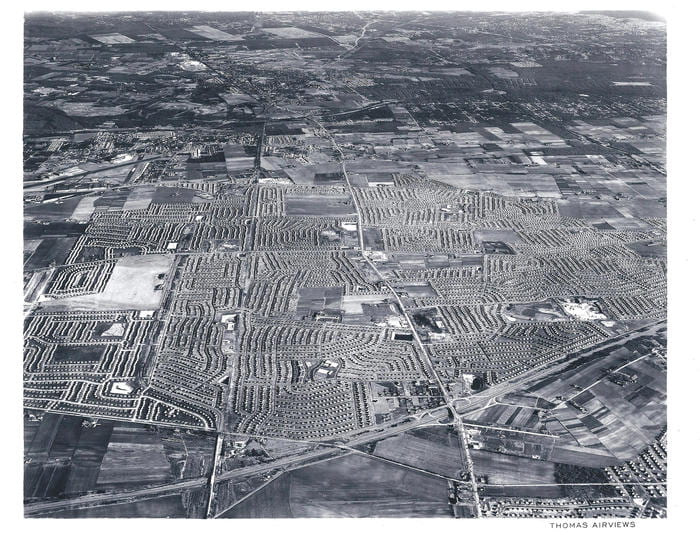
Levittown, America’s most famous mass-produced suburb, was replicated in Pennsylvania, Long Island, and New Jersey
Conclusion
Geography is central to the construction of New Jersey’s suburban and anti-urban identity. The basis for this state’s suburban culture was laid out from the state’s earliest days, as reflected in practices of municipal consolidation and political fragmentation. This fragmentation pulls population, political power, and economic energy from the state’s cities that would, in a more centralized political system, command more influence. Moreover, this decentralization, as born out through analysis of census data, contributes to racial segregation and income inequalities between the micro-climates of one town to the other. Most of all, through this analysis, the burden of history becomes visible: Despite a surface appearance of renewed interest in cities, the powerful historical forces of politics and precedent ensure that New Jersey will remain a sea of suburbs. As the world is confronted with the combined crises of climate change and a younger generation locked out of the housing ladder, New Jersey’s suburban culture seems more than ever out of date and warped in time.
If the growth patterns of New Jersey mirror the larger experience of America, the future of urban culture looks bleak indeed. Cities like St. Louis and Detroit might regain some of their former energy and vitality, but it is unlikely that they will become as powerful again as they once were. A 2020 study analyzed satellite imagery and correlated the percentage of paved surface area to the likelihood that people living there would vote Democrat or Republican. Unsurprisingly, the greater the amount of area paved with roads and buildings, the greater the likelihood of people living there opposing Donald Trump. If, as Kenneth Jackson writes, “The space around us―the physical organization of neighborhoods, roads, yards, houses, and apartments―sets up living patterns that condition our behavior,” then efforts to rebuild our cities are very much part of the larger political project to rebuild our democracy.
Related commentary
“Turning Affluent Suburbs Blue Isn’t Worth the Cost,” New York Times op-ed by historian Matthew Lassiter. To win elections, Lassiter argues, democrats needs to stop courting the votes of educated middle class Whites from the suburbs. Suburban voters already benefit from municipal fragmentation, local autonomy, and land use polices that, in effect, bar poor people and Black people from living nearby. “Democrats cannot cater to White swing voters in affluent suburbs and also promote policies that fundamentally challenge income inequality, exclusionary zoning, housing segregation, school inequality, police brutality and mass incarceration. [….] It’s no coincidence that the bluer that suburban counties turn, the more unequal and economically stratified they become as well.” Urban areas are epicenters where the problems of inequality, racism, and gentrification are most visible. Therefore only in appealing to the interests of minorities and the working class who have traditionally lived in more urban areas can Trumpism be defeated. After all, Plato’s Republic and the Greek Democracy originated from the city state, not the suburb.
Sources
Expand list of data sources and bibliography
Data for all municipalities:
- Population of all municipalities from 1940 to 2000, from NJ State Data Center report (table 6, p. 26-51)
- Shapefile of municipal boundaries with 2010 population of each municipality, from NJ open data
- List of municipalities by year incorporated, from Wikipedia
- Three data sources above are merged into these visualizations, posted to Tableau for free download.
Data for New Jersey’s six leading cities:
- Populations and races of NJ’s six largest cities from 1810 to 1990, from US Census Bureau working paper (table 31, p.78-79) and this documentation page
- Populations and races of NJ’s six largest cities for 2000 and 2010, from NJ state’s census viewer website because above table was only up to 1990
- Two data sources above are merged into this visualization, posted to Tableau for free download.
Other sources:
- NJ population density map from Social Explorer
- Analysis of transportation patterns, from NJ Department of Transportation report
- Satellite imagery of the entire state in 1930 offers a comparative view of the rural “Garden State” before suburban sprawl, from NJ Office of GIS
Further reading:
- Boustan, Leah P.. Competition in the Promised Land: Black migrants in northern cities and labor markets. Princeton: Princeton University Press, 2017.
- Cohen, Lizabeth. A Consumer’s Republic: the politics of mass consumption in postwar America. New York: Vintage Books, 2003.
- Fishman, Robert. Bourgeois Utopias: the rise and fall of suburbia. New York: Basic Books, 1987.
- Jackson, Kenneth T. Crabgrass Frontier: the suburbanization of the United States. Oxford, England: Oxford University Press, 1985.
- Kruse, Kevin M., Thomas J. Sugrue (editors), and Gerald Frug. “The Legal Technology of Exclusion.” The New Suburban History. Chicago: University of Chicago Press, 2006. Pp. 205-19.
- Snyder, John P. The History of New Jersey’s Civil Boundaries, 1606-1968. Trenton: Bureau of Geology and Topography, 1968.