• This website includes dozens of videos, hundreds of essays, and thousands of drawings created over the past twenty years. Search to learn more about the history of buildings, places, prisons, Newark, New York City, and my PhD research on spatial inequality.

  • Or scroll down for the latest publications.

Time-Lapse Evolution of Istanbul’s Urban Form: 330 AD to Present

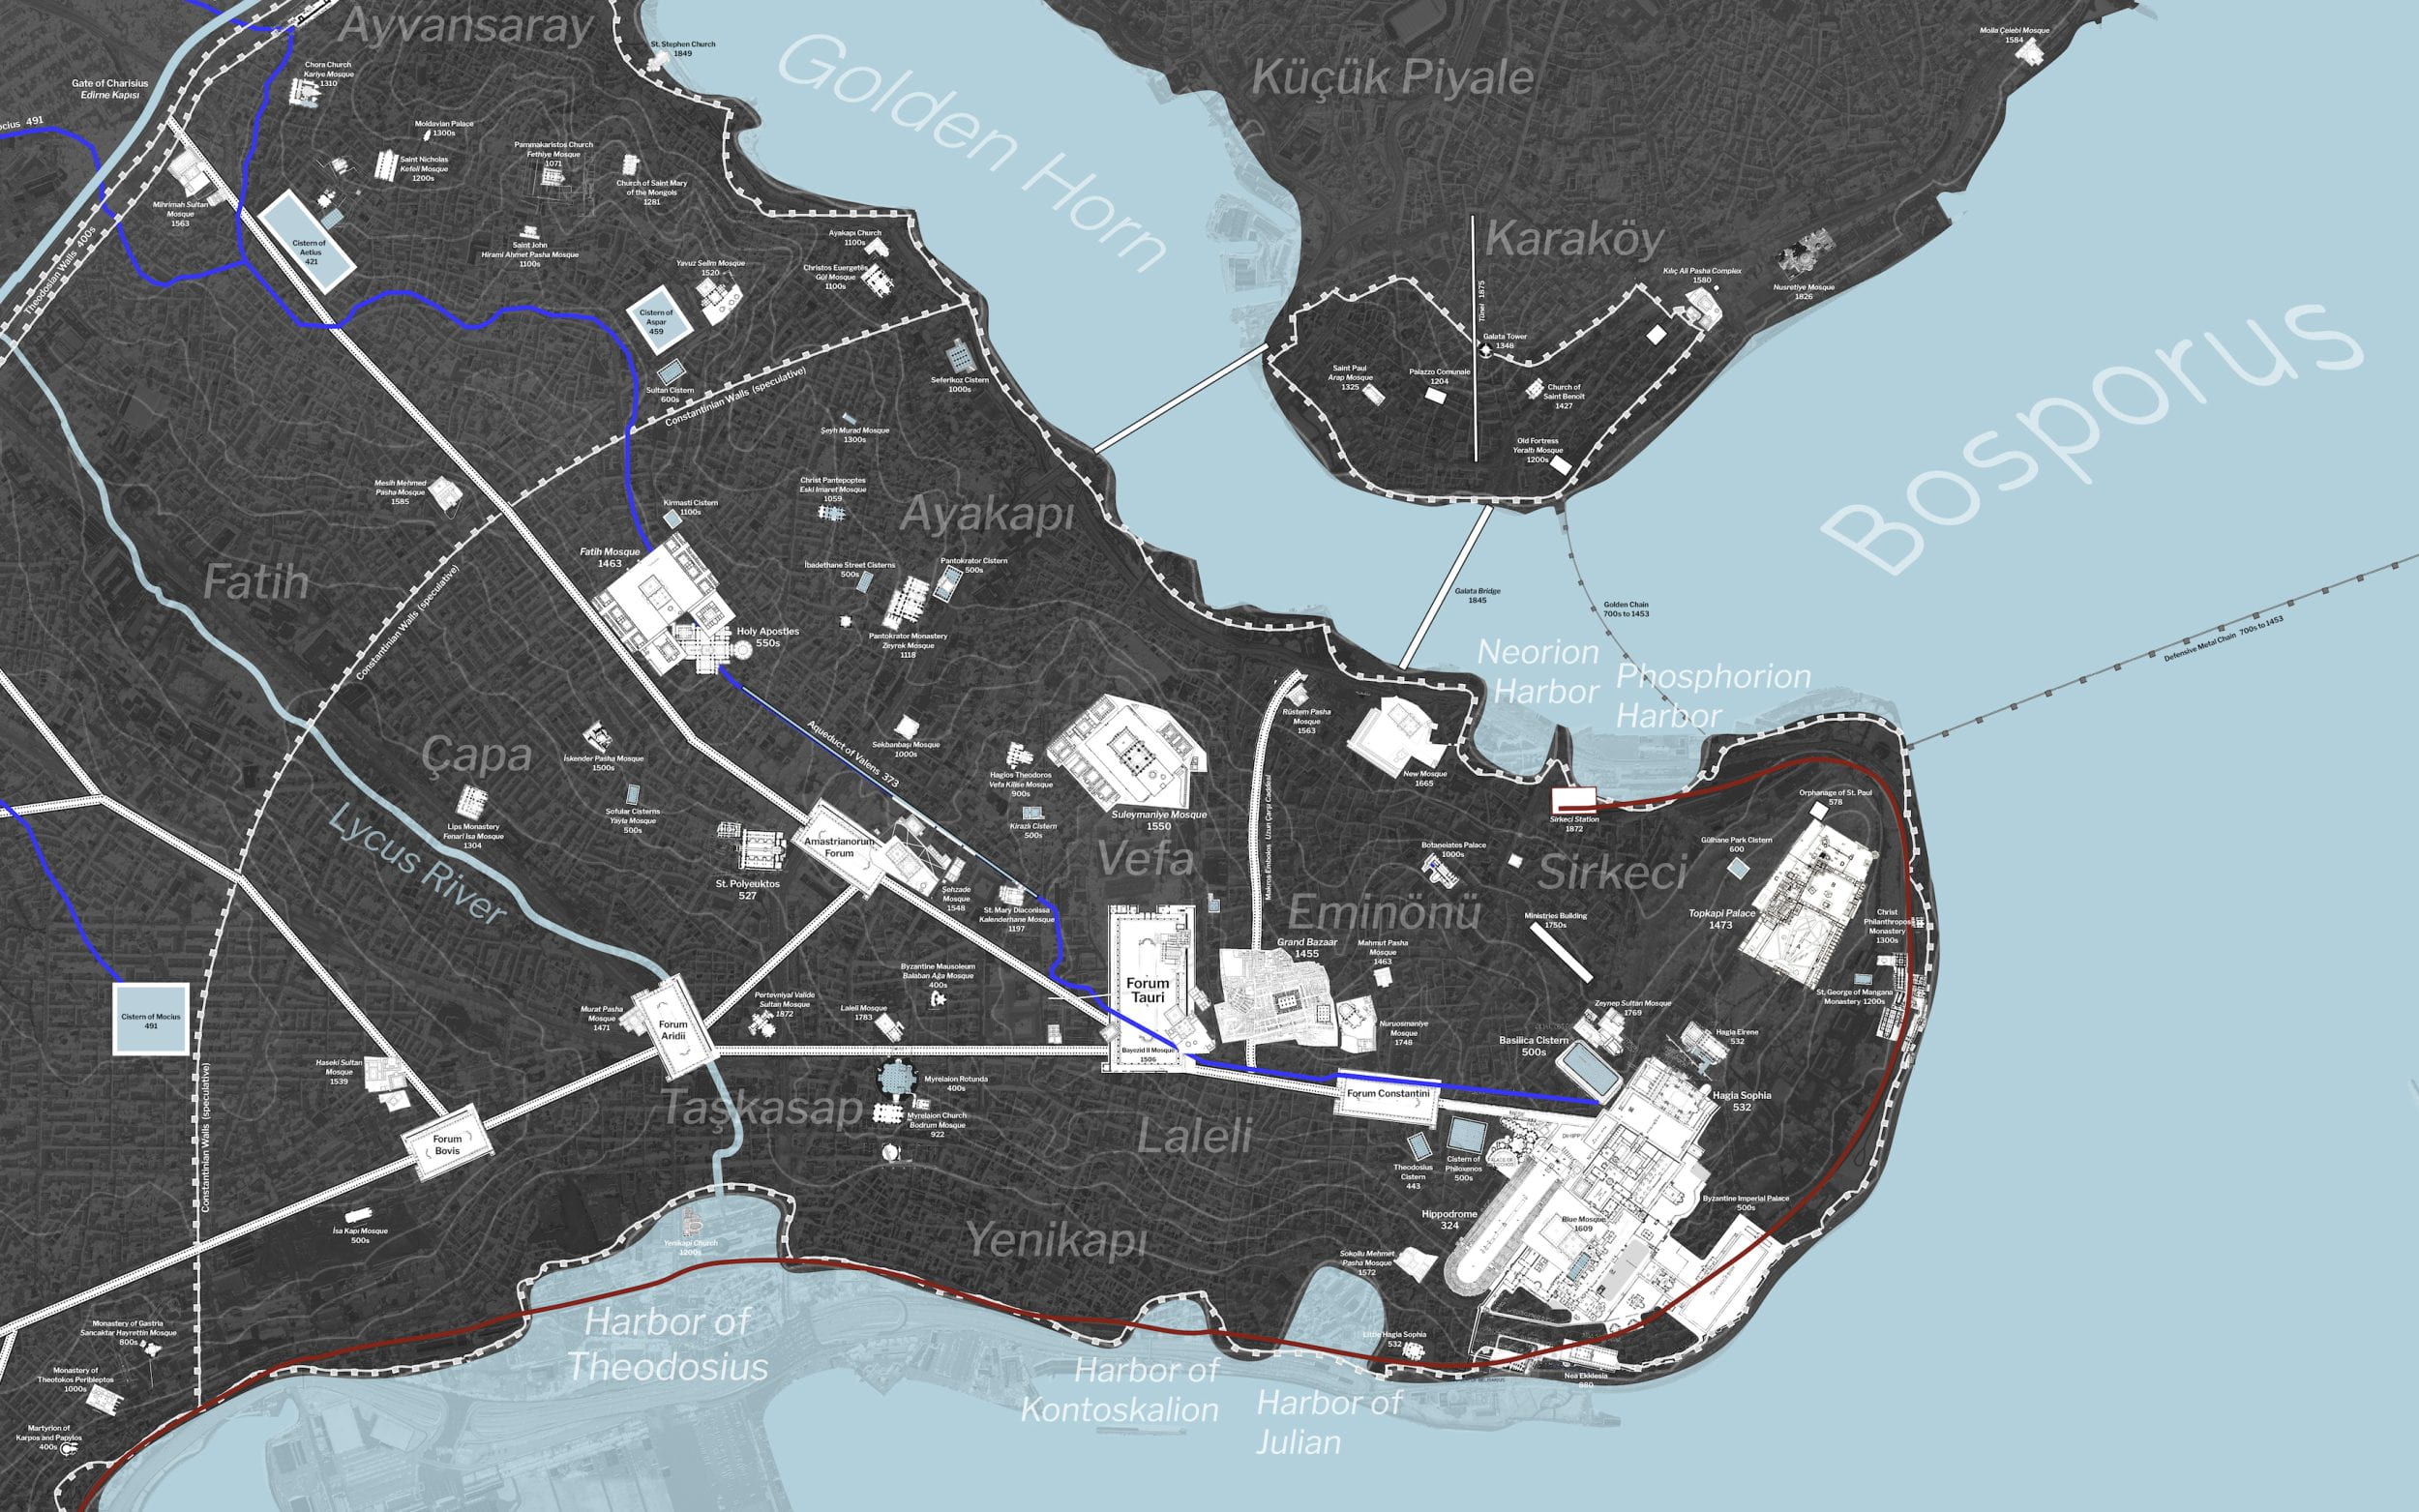
Using the tools of historical cartography and geographic information systems (GIS), this time-lapse animation reconstructs the urban form of Istanbul during key periods of its millennium-long history. All of about 200 known and major archaeological sites are drawn in scaled plans and overlaid above the city’s contemporary geography. The process reveals Istanbul as a city of layers, spanning three key periods of settlement: the age of Byzantine rule and Christianity (330AD to 1453), the age of Ottoman rule and Islam (1453 to 1923), and the emergence of Istanbul as a model metropolis of population fifteen million (1923 to present).
The accompanying soundtrack I assembled echoes the spirit of each age: a Greco-Roman Lute, a Turkish lavta, and then electronic music for the modern age of a now global metropolis. As the Byzantine Empire ends and the Ottoman Empire begins, the sounds of the Greek lute fade to the Turkish lavta. As the Ottoman Empire ends and as Istanbul becomes the modern metropolis of today, the rhythm of an electro-heartbeat punctuates a recording of voices speaking multiple languages on Istiklal Caddesi in Beyoglu.
For each of three eras, the map also overlays the estimated locations of Istanbul coastlines that were – and are – in the process of movement as the city builds new land to support population growth. On the more detailed and labeled static map below, you can zoom in to reveal the plan of each archaeological site. For instance, Christian churches were converted into mosques after the 1453 Ottoman conquest. They are labeled with their original Christian names in bold, their Ottoman re-namings in italics, as well as the date of their original construction. Also shown are the known locations of buried water cisterns and the paths of the two major aqueducts that filled them: the Aqueduct of Mocius (entirely demolished) and the Aqueduct of Valens (still in existence). Other features shown on the map include the topography of Constantinople’s seven hills, neighborhood names (both Byzantine and Turkish), and the speculative locations of the Roman roads (via / mese) that terminated at civic spaces (forums).

.

Research Method and Source Files:

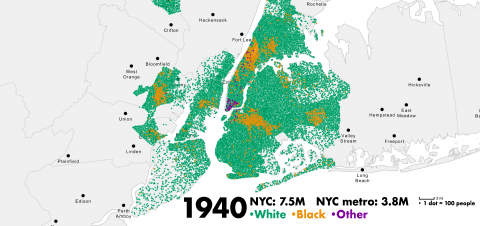
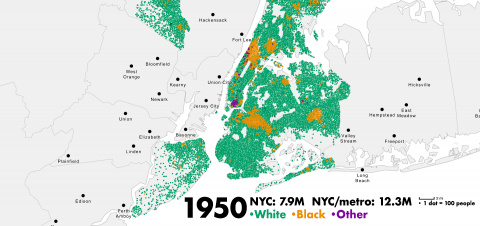
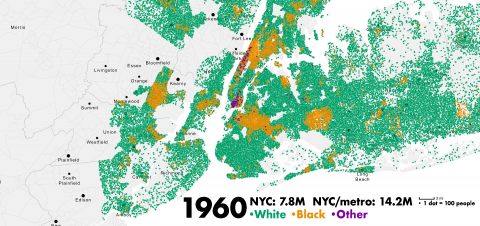
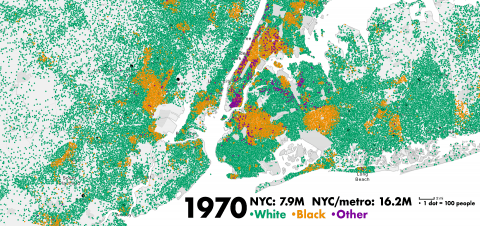
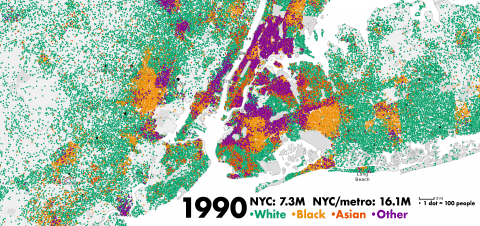
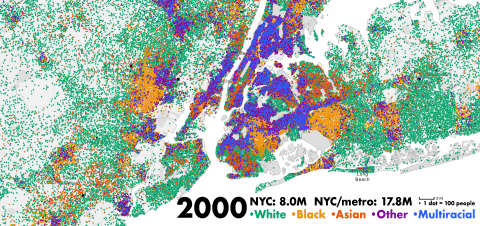
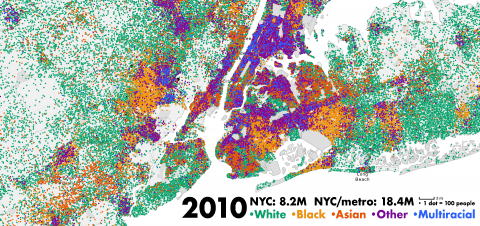
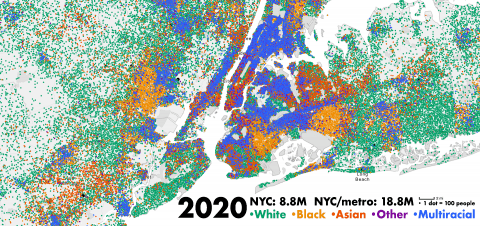
This project uses QGIS and Adobe Illustrator, similar to my time-lapse evolution of New York City’s urban from from 1609 to present. Building plans are sourced from archaeological reports, edited and re-colored to the same scale in Photoshop, and then geo-referenced above the contemporary satellite imagery in QGIS. Labels and final color corrections were then made in Adobe Illustrator. And lastly zoom animations were added with music in the Final Cut Pro software for video editing. To access the geo-referenced maps and building plans behind this project, please email me. I am happy to share them with you.

.

View full size image >

.

Source Maps and Inspirations:

1. David Hendrix, The Byzantine Legacy: Maps of Constantinople, 2016.
Data on key buildings – all surviving Orthodox churches, water cisterns, palaces, main roads, and civic spaces – in ancient Constantinople. Data on building plans and the source for most maps on which this time-lapse film is based.

.

2. Şehri Konstantin, City of Constantine: Mapping the remnants of Byzantine Constantinople, 2020.
Data on key monuments and their coordinate locations in present-day Istanbul.

.

3. Aga Khan Trust for Culture, Archnet, Aga Khan Documentation Center at MIT, 2016.
Source for the majority of building floor plans incorporated as images into this map: https://www.archnet.org/search.

.

4. Media Center for Art History, Columbia University, c.2000. Source for some building plans.

.

5. Wikimedia Commons, Map of Byzantine Constantinople, 2008.

.

6. Notitia Urbis Constantinopolitanae, c.425-550s.

.

6. Lanciani, Rudolfo (cartographer) and Edizioni Quasar (publisher), Forma Urbis Romae, 1901 / 1990.
Inspiration for my maps of Istanbul came from these maps of Rome. This composite map of ancient Rome in a grid of 46 sheets overlays on a single map the various layers of Rome’s 3,000-year history: one color for buildings of Roman date, another for medieval and Renaissance, and a final color for the contemporary city. The name of this map of Rome inspires the name of my project map: Forma Urbis Constantinopolis.

.
.

Audio Sources:

In order of appearance

1. Brian Kay, Oldest Complete Song: “Epitaph of Seikolos” on the Greek Lyre and Har-Mose Lute, 2021.
Ancient Greek music performed on the ancient lute, minutes 7:33 – 11:48.

3. Traditional Turkish Music on the Lavta, 2022.

4. Modern electronic pop and sweet guitar, 2016
█​█By username “frankum” on Freesound.org

5. Istanbul Streetscape on Istiklal Caddesi in Beyoglu, May 2007.

Envisioning Seneca Village

A project by Gergely Baics, Meredith Linn, Leah Meisterlin, Myles Zhang

In collaboration with the Central Park Conservancy and the Institute for the Exploration of Seneca Village History

.

Email project authors


As featured in the magazine of Barnard College at Columbia University, Fall 2024
As featured by the Central Park Conservancy, the park’s official website
As featured by Urban Omnibus, Spring 2025


Envisioning Seneca Village depicts what this significant nineteenth-century village might have looked like in the spring of 1855, about two years before it was destroyed by the City of New York to build Central Park. It features an interactive 3D model, a non-interactive tour through the 3D model (A Tour through the Visualization), a printable PDF guide with maps (A Map-based Tour), and supplementary materials. The project is anchored in extensive scholarship and aims to make the village’s history visible to a wide audience.
Seneca Village was a community established by African Americans in 1825, two years before emancipation was completed in New York State. By the mid-nineteenth century, the village was the home of at least 50 families—about ⅔ Black and ⅓ white, mostly Irish. It was situated on an approximately four-block area east of present-day Central Park West between 82nd and 86th Streets, which was then a few miles north of the city’s urban core and between the villages of Bloomingdale to the west and Yorkville to the east. This location offered a safer, freer environment to live than downtown. Villagers built a thriving, complex, and heterogeneous community with core institutions including three churches and a school. Seneca Village’s destruction by the City in 1857 abruptly ended 30 years of successful efforts to nurture families, sustain livelihoods, and create community. It was also the first instance in a long history of the City’s abuse of eminent domain to sacrifice Black neighborhoods for urban development projects—in this case, to build a world-famous park.


3D Model References and Methodology. See also: Tips for Navigating the Model.

As residents scattered to different parts of New York and the Northeast, the Park construction crew buried building debris, covering it with landscaped lawns, hills, and paths. The community’s memory faded for a century and a half. Yet the lives the villagers made there left both an archival paper trail and extensive material traces underground. Since the 1990s historians, archeologists, educators, descendants, and artists have mined the fragmentary sources, excavated the site, and sought new ways to recover the village’s history and memory.
Despite all of the information that researchers have unearthed, there is a lot that is still unknown about the village and its community members. It is hard to imagine what it was like to live there. No photos or drawings survive, the present-day Central Park site is devoid of above-ground traces of Seneca Village’s built environment, and this region of New York City was quite different in the nineteenth century than today. Envisioning Seneca Village addresses these blindspots by creating a visual interpretation of the village that integrates social historical, archival, and archeological evidence into digital cartographic and architectural reconstruction. Through this model we seek to amplify existing scholarship, help visitors to learn more about the village’s history, catalyze new research with the questions the model raises, and above all, keep the memory and spirit of this past community alive in the present.
Envisioning Seneca Village is a collaborative project between Gergely Baics, Meredith Linn, Leah Meisterlin, and Myles Zhang that integrates our expertise in archaeology, social history, historical geographic information systems (GIS), and digital architectural reconstruction. The project has been aided by research assistants, additional support from the Central Park Conservancy, and generous guidance from a diverse group of Seneca Village advisors and stakeholders. Learn more about the project and team.


High-resolution still images provided on the project site (A Tour through Seneca Village).
Printable PDF version of the tour through the Envisioning Seneca Village model, with site maps is live. See “Envisioning Seneca Village: A Map-based Tour.”
To cite the project: Gergely Baics, Meredith Linn, Leah Meisterlin, and Myles Zhang. 2024. Envisioning Seneca Village. Website with interactive 3D model. envisioningsenecavillage.github.io


Project Map Launch

Juneteenth 2024 in Central Park, at the site that was once Seneca Village


Project Workflow

Homeownership and the Racial Wealth Gap

Presented March 5, 2024 at the Newark Public Library

.

.

The world’s largest concentration of wealth is in the New York City metropolitan area, yet the region contains many under-resourced cities, including Newark. What historical factors created this division between low-income Newark and its wealthy neighbors along lines of race, housing, income and social class?
The agents of change are more complex and nuanced than a simple narrative of redlining and white flight following the 1967 uprising. From discriminatory actions by the Federal Housing Administration and highways that carved through the urban fabric, to suburbs that pulled middle-class families away from Newark and factories that relocated outside of the city, contemporary poverty in Newark was more than a century in the making.
Drawing from the archives of the Newark Public Library, this presentation examines the range of challenges Newark faces and how the city overcomes. This is a Newark History Society program, co-sponsored by NJPAC and the Newark Public Library. Light refreshments will be served.
The presenter is Myles Zhang, urban historian and doctoral candidate at the University of Michigan in Ann Arbor.
This presentation will evolve into my dissertation entitled:
“An island of poverty in a vast ocean of material prosperity”:
Homeownerhip and the Racial Wealth Gap in Newark

.

.

.

1959 Map of “Blighted” Areas by Newark Central Planning Board

.

View event on NJPAC website

Jersey City: Urban Planning in Historical Perspective

This project in two parts is a brief history of city planning in Jersey City
and a building-level interactive map of the entire city in 1873, 1919, and today.

.

Read / download book as PDF

Download opens in new window

.

Jersey City: Urban Planning in Historical Perspective
A booklet about the history of the master plan

Over its four-century history, the evolution of Jersey City mirrors the larger history of the New York region. Each generation of Jersey City residents and political leaders have faced different urban challenges, from affordable housing, to clean water, to air pollution, and income inequality. Each generation has responded through the tools of city planning and the master plan.
Jersey City’s six master plans – dated 1912, 1920, 1951, 1966, 1982, and 2000 – capture the city at six historical moments. Reading these plans and comparing them to each other is a lens to understand urban history, and American history more broadly.

.

Classroom Discussion Questions

1. How has the built environment of Jersey City evolved in the past century?
2. Who has the right to plan a city?
3. Who has the right to shape a city’s future?
4. Do you feel you have power over the plan of your city?

Read More

.

Reflections on my experience as PhD student, halfway through the program

As a third year student, I am more than halfway through the PhD program. So I thought now is as good a time as any to reflect.
In the same spirit of making public my undergraduate application to study at Columbia and my PhD application to study at Michigan, I am sharing the exam essays I wrote as a PhD student. When applying to Columbia, Oxford, Cambridge, and now Michigan, I struggled to find online example essays and statements that had worked for other applicants. In my case, I was fortunate to have academic parents to read my application statements and college professors to mentor me on how they saw admissions from the other side of the table. But I also realize that most applicants do not have these kinds of advantages in their social networks and must rely more on the internet for advice.
After 40 credits of coursework to be completed in no more than two years, I am expected to take a series of exams that qualify me to write the dissertation. When applying to PhD programs, I had no idea there were prelim exams or what the requirements were. Each prelim exam is different, unique to the student and my relationship with the faculty committee members on my dissertation. The exams consist of four things:

1. A Prelim Reading List: books assigned to me by committee members Robert Fishman, Ana Morcillo Pallarés, and Matthew Lassiter.
This list is the basis for their two questions.

2. A Minor Essay on Metropolitan History: written in 48 hours timed environment

3. A Major Essay on 20th-c. Urban History: written in 96 hours

4. A 90-minute exam with full committee to grill me on knowledge of reading list and topics not covered in the essays

I am posting them online, not as a “model” for what the ideal exam should look like and more as an inflection point and sample of the document that the members on your committee could expect you to write some day. In full disclosure, I am also sharing the draft of what will become my PhD proposal and the rough draft of three chapters completed. Maybe this reduces the cultural capital required to succeed at elite institutions. At the least, it is the kind of document I wish I could have had and known about when I was applying to PhD programs.

Read More

.

PhD Dissertation Project (draft in progress)

Creating the Divided Metropolis:
How Newark came to be a poor city in a wealthy region

A dissertation submitted in partial satisfaction of the requirements for the degree Doctor of Philosophy in Architecture

.

Project Brief

“Wherever American cities are going, Newark will get there first” Mayor Kenneth Gibson declared in 1970, as the first black mayor of any major city in what is now the American Northeast and the Rust Belt. The history of Newark’s urban decline is specific to Newark and unique to the details of this city. And yet, Newark’s story is national in its implications, and mirrored in hundreds of other American cities large and small that also experienced decline.
From the 1950s through 1970s, Newark embarked on one of the most extensive programs of state-funded urban renewal in the nation, less costly only than those of New York City (20 times Newark’s population); Chicago (eight times larger); Philadelphia (five times larger), and Boston (twice as large). Newark’s program was certainly among the most ambitious: to clear out the areas called slums, to construct highways, to build public housing, to stimulate the urban economy, and – in the end – to stop urban decline. And yet for all the billions spent and an estimated 70,000 out of Newark’s 400,000 people displaced, the program failed to reverse urban economic and population decline. What mixture of actors and institutions – city planners, politicians, realtors, developers, and banks – caused Newark’s program to fail?
This project describes how two national programs impacted Newark: urban renewal (a program that invested in keeping the city stable) and redlining (a program that deprived investment to make the city unstable). The two programs – both initiated by local, regional, and federal governments and designed to profit real estate developers – coexisted and undermined each other in a decade of flaws and contradictions. Redlining usually refers to the practice when banks choose to not invest in a certain neighborhood or city because of the race of who lives there. Redlining is racial and economic discrimination. More importantly, although rarely framed in such terms, redlining describes the practice more broadly of choosing not to invest in a place because it is a city and considered a less profitable investment. Banks, developers, realtors, businesses, department stores, and the fabric of social institutions vital for urban life all migrated from the city to the suburbs. These other institutions all redlined Newark independently of the real estate lobby. More than anti-black, redlining is anti-urban.
This project frames Newark’s story in national terms. Each chapter examines one form of redlining in Newark, and then frames this form of localized redlining in the national picture of urban abandonment. There are five frames: transportation, finance, housing, welfare, and employment. This range of actors across areas – public and private, local and national – did not collaborate in a conspiracy to deprive Newark and the American city of wealth. But their actions overlapped and mutually reinforced each other to leave the American city behind and ensure that attempts to save the city through state-funded urban renewal would fail. Through anti-urban redlining practices in each of these five areas – transportation, finance, housing, welfare, and employment – urban decline was the inevitable result. The history of all places is told through one place, and the history of one place is told through all places.

.

Drafts of Chapters in Progress

Interstate Highways in Newark

Public Housing in Newark

How an infrastructure project ruined a racially integrated neighborhood
How public housing was designed to fail black families

.

Committee Members

Robert Fishman, planning history
Ana Morcillo Pallarés, built environment
Matthew Lassiter, urban/suburban history

.

See all my urban history publications about this place

.

See all my artwork about urban decline and urban decay

.

The Last Two Miles (draft of dissertation chapter)

Published to my website privately, under consideration for publication in Journal of Urban History

Weequahic before the highway, 1960
Same view after the highway, 2023

.

How an infrastructure project contributed to today’s urban-suburban racial wealth gap

City planners designed Interstate 78 to destroy a stable and racially integrated neighborhood of 7,500 middle-class homeowners

.

Weequahic in 1955 before the highway
Weequahic in 2023 after the highway

.

It did not have to be this way…

In 1958, the New Jersey State Transportation Department had a choice: Build Interstate 78 on a route that displaced some 43 families in the suburb of Hillside or build it on a path that displaced some 7,800 Jewish and black families in one of Newark’s only racially integrated neighborhoods. Engineers and planners chose the urban highway path through the Jewish and black neighborhood over the less destructive suburban route. It is a story local to Newark, but mirrored hundreds of times across the landscape of other American cities. The story of Interstate 78 is a microcosm that reveals much about the politics and inequalities of city planning in a suburban and auto age.
Highways slice through Newark on all sides. They cut the city into parts and divide neighborhoods from each other. The millions of cars and trucks that pass through Newark annually emit soot particles that give Newark air the highest concentration in the state of nitrogen dioxide and carbon monoxide. To the east of Downtown is the six-lane Route 22 built in the 1930s that divides the city from the Passaic River and restricts public access to the waterfront. To the north of Downtown is the six-lane Interstate 280 built in the 1940s. To the west of Downtown is the eight-lane Garden State Parkway built in the 1950s that divides Newark from commuter suburbs to the west. To the south of Newark is the ten-lane Interstate 78 built in the 1960s that divides Newark from historically and once majority-white suburbs like Hillside.
Collectively, these four roads box in Newark from four sides. New Jersey’s largest concentration of poverty, where the median family income is a mere $38,000, is separated from the rest of the state by a highway moat up to 400 feet wide in parts of Interstate 78. By contrast, the median family income in the Essex County suburbs that surround Newark is over $100,000. Pre-pandemic some 200,000 residents of these commuter suburbs drove into Newark on these highways, parked in Newark, made salaries on average above $50,000, and drove home at the end of each workday, leaving behind some 300 acres of surface parking lots.
It did not have to be this way.

.

Based on archival records, planning documents from the Newark Public Library, and racial redlining records from the federal government, read the full report on how the Weequahic community fought and failed to block construction of Interstate 78.  →

9,000 words, 21 pages

.

Belmont Avenue in 1962
Identical camera angle in 2023

.

Two proposals for the path of Interstate 78
A destructive proposal from state planners vs. an alternative vision from Newark residents

.

Proposal from State and City Planners Proposal from Weequahic Residents
Length in miles 4.52 About 4.7
People displaced 7,818 Fewer than 500
Demographics 10% black Fewer than 1% black
Homes demolished 2,247 homes 40 homes

.

Johnson Avenue in 1961
Identical camera angle in 2023


.

1. Further viewing and interactive mapping
Photo comparisons of Newark’s Weequahic neighborhood before vs. after highway construction, in 1962 vs. today
Related publication from my website Newark Changing
2. Further Reading
For a near parallel story, see Robert Caro’s chapter on how Robert Moses drove the Cross Bronx Expressway through the Jewish neighborhood of East Tremont. In a story both local and national, Moses could have routed the highway through an adjacent park on path that would have displaced only a few hundred people. He chose the path through East Tremont, resulting in what Caro claims was the destruction of 2,000 families from a stable working class tenement neighborhood. Read more at:
Robert Caro, “Chapter 37: One Mile,” in The Power Broker (New York: Vintage Books, 1974).
3. Acknowledgements
I am grateful to my parents for their unwavering support of my studies, as well as my dissertation adviser Robert Fishman. Newark still struggles with the legacies of redlining and ongoing air pollution from its highways, port, and airport. In this fight against environmental racism, the activists at the South Ward Environmental Alliance and Ironbound Community Corporation are key actors. This history essay is written for them.

.

Jeliff Avenue in 1962
Identical camera angle in 2023

.

.

Hillside Avenue in 1962
Identical camera angle in 2023


A home is half the promise. (draft of dissertation chapter)

Published to my website privately, under consideration for publication in Journal of American History

How market forces undermined the promise of public housing in Newark

.

Building 7 at Newark’s Scudder Homes demolished in summer 1997

.

To bring about integration, the first to do is to do it. [….] The change-over to a policy of nonsegregation is not so difficult and troublesome as one anticipates. [….] If a housing authority shows complete sincerity in the change and never retreat from their announced position with respect to non-segregation, the change will be successful. This, in any case, is what we have found to be true in Newark.

– Newark Housing Authority Executive Director Louis Danzig, 1952


In 1962, the future of racial integration in Newark looked promising. Newark’s newly elected Mayor Hugh Addonizio praised the movement toward racial integration before a meeting of the United States Commission on Civil Rights in Newark City Hall. He described the apparent success of urban renewal to build high-quality public housing projects in black neighborhoods. Thousands of families once lived in wood frame tenements without central heating, interior plumbing, and private bathrooms. They now lived in public housing where, for the first time in their lives, they had their own bedrooms, bathrooms, and year-round steam heating.
Newark’s program of urban renewal cost taxpayers at least 128 million in federal funds (1.4 billion in 2020 dollars) and 53 million in local funds (550 million in 2020 dollars). This program costing by 19677 two billion (adjusted for inflation) gave Newark the fifth most expensive urban renewal program in the nation after New York, Chicago, Philadelphia, and Boston. An estimated 55,000 more were displaced from their homes in the process, 45,000 for urban renewal and 10,000 for highway construction. By the end of this program, some 37 thousand people, representing about one in every ten Newark residents, lived in public housing.
Just eight years before in 1954, the U.S. Supreme Court ruled in Brown v. Board of Education that separate was not equal and that racial segregation laws were not legally enforceable. In the few years before Brown, Newark had already moved to desegregate public housing and to assign residents to whichever of the city’s approximately fourteen public housing projects they preferred. Newark public schools also seemed to offer the promise of racial integration. The city’s population was 66 percent white in 1960 and 34 percent black. This would mean that every public school, if fully integrated city wide, would have two white children for every black child. The mixed incomes and races across Newark seemed to offer the possibility of a future egalitarian metropolis: schools and neighborhoods of both diverse races and diverse incomes.
For all its promises, this program of urban renewal failed spectacularly. By the 1980s, opponents and activists described urban renewal and public housing as “The Second Ghetto,” as high-rise slum housing as dangerous as the ghettoes they were supposed to replace. By 2010, most of Newark’s public housing from the urban renewal age had been demolished. Other lands cleared of homes to build urban renewal projects never found the financing to build and remain vacant lots. Among dozens of high-rise towers of public housing containing thousands of apartments, all but seven towers were demolished. The urban poor were expelled from public housing towers that had become concentrations of crime, drugs, poverty, and decay.
The program had fallen far from its hopeful origins when President Harry Truman signed urban renewal into law with the 1949 Housing Act. Truman announced at the program’s launch: “The private housing industry cannot in the foreseeable future provide decent housing for these families. Their incomes are far too low to cover the cost of new housing of any adequate standard. [….] We have a national responsibility to assure that decent housing is available to all our people.” By 1963 at the height of the civil rights movement, James Baldwin famously characterized urban renewal as something “most northern cities now are engaged; it is something called urban renewal, which means moving the Negroes out. Getting it means Negro removal; that is what it means. And the federal government is an accomplice to this fact.” In the span of these fourteen years, a program Truman described as the fight to create “decent housing” had evolved into what Baldwin characterized as “Negro removal.”
The reasons behind the failure of public housing are more complex than simple reasons like “Negro removal,” poorly designed architecture, or state hatred for black people. Urbanist thinker Jane Jacobs blamed the failure of public housing on architecture. High-rise towers of public housing, she claimed, were too tall and too modern an architecture for families used to living in old tenements, Victorian townhouses, and rural farms. But the failure of social housing in Newark was not caused by poor design choices, low-quality architecture, or the supposed prejudice of the people who built and directed the program of urban renewal. Nor was the failure of social housing caused by the poor families, and especially rural black families who lived in these houses and were – the legend claims – unprepared for urban life. Instead, the failure has more do with employment discrimination, urban abandonment, and market policies that chose to under-invest in Newark and its people. These private forces collectively ensured the public failure of the Newark Housing Authority’s two billion dollar program of urban renewal.
Fundamentally, public housing in Newark was a two-part promise. Good homes at affordable prices for poor families were one half the promise: a promise met and provided by the public section. Economic mobility and non-discrimination in employment for those living in public housing was the missing half of the promise. It was a promise that the private sector failed to meet in an age of de-industrialization and suburbanization.

.

Based on archival records, planning documents from the Newark Housing Authority, and old newspaper articles, read the full report on how public housing in Newark was designed to fail.  →

9,300 words, 23 pages

.

Acknowledgements
I thank the archivists of the Newark Public Library and City of Newark Archives for granting me access to the primary sources that make my work possible. I also thank Newark-native Brendan O’Flaherty. His textbook on urban economics framed my understanding of Newark. His unpublished text chapter “How did Newark get to be a city where people aren’t rich?” also provided me a framework to understand the contemporary landscape of poverty in Newark. I am grateful to Zemin Zhang for his research on Louis Danzig and the history of the Newark Housing Authority. Last of all, I am grateful to the residents of Newark public housing, for their struggle and their perseverance to live in a system rigged against them.

The City as Carceral State

Context: The following personal essay accompanied my application for the Gupta Values Scholarship from the University of Michigan. I am sharing it here because it speaks more broadly to my background, education, activism, and research interests.

.

Entrance gate to the Old Essex County Jail

.

One out of every one hundred black men in my neighborhood of Newark, NJ is currently in prison. At least half have a permanent criminal record as formerly incarcerated people. Most charges are for drug use and possession, often marijuana records from when marijuana was illegal. My earliest memories of Newark are of the homeless walking down our street to the nearby food pantry and young men carrying boom boxes on their shoulders (this was before the iPod). I will always remember observing one woman as she passed our house each day. The first time I saw her, she had been recently evicted and dragged two suitcases behind her. With each passing week, the suitcases gradually grew lighter until – after several weeks – all she had left was a grocery bag of belongings, her dignity gradually stripped away. Up our street was the public housing project of Baxter Terrace – three-story red brick barracks where the urban poor lived under constant police surveillance. Most were unemployed and all were on public welfare.
I remember taking the train to school in the suburbs. In the span of only five miles, vacant lots and abandoned buildings in one of the nation’s poorest cities gave way to large homes on tree-lined streets in one of the nation’s wealthiest suburbs. The distance of five miles – or in some cases a single city street – was all that separated the poverty of my city from the wealth of its suburbs. At the city limits of Newark, a system of one-way roads, streets without sidewalks, and aggressive “neighborhood watch” signs separated the city from the suburb. On one block, apartment buildings, treeless streets, and bodegas that accepted food stamps. Just one block over, there were century-old trees and four-bedroom homes selling for up to a million dollars. Here in these suburbs, homeowners commuted to Downtown Newark each day and returned home each night, bringing home with them the wealth they made in the city. So little and yet so much separated these two worlds.
Martin Luther King described America in a 1968 speech he gave in Detroit: “There are literally two Americas.  Every city in our country has this kind of dualism, this schizophrenia, split at so many parts, and so every city ends up being two cities rather than one. There are two Americas. One America is beautiful for situation. [….] But there is another America. In this other America, thousands and thousands of people, men in particular walk the streets in search for jobs that do not exist.” So much and yet so little has changed since 1968. The racial wealth gap is almost the same today as it was in 1970. In Newark, median black family income is less than $30,000. In Newark suburbs, median family incomes are over $100,000.

Read More

.