• This website includes dozens of videos, hundreds of essays, and thousands of drawings created over the past twenty years. Search to learn more about the history of buildings, places, prisons, Newark, New York City, and my PhD research on spatial inequality.

  • Or scroll down for the latest publications.

Time-Lapse Evolution of Istanbul’s Urban Form: 330 AD to Present

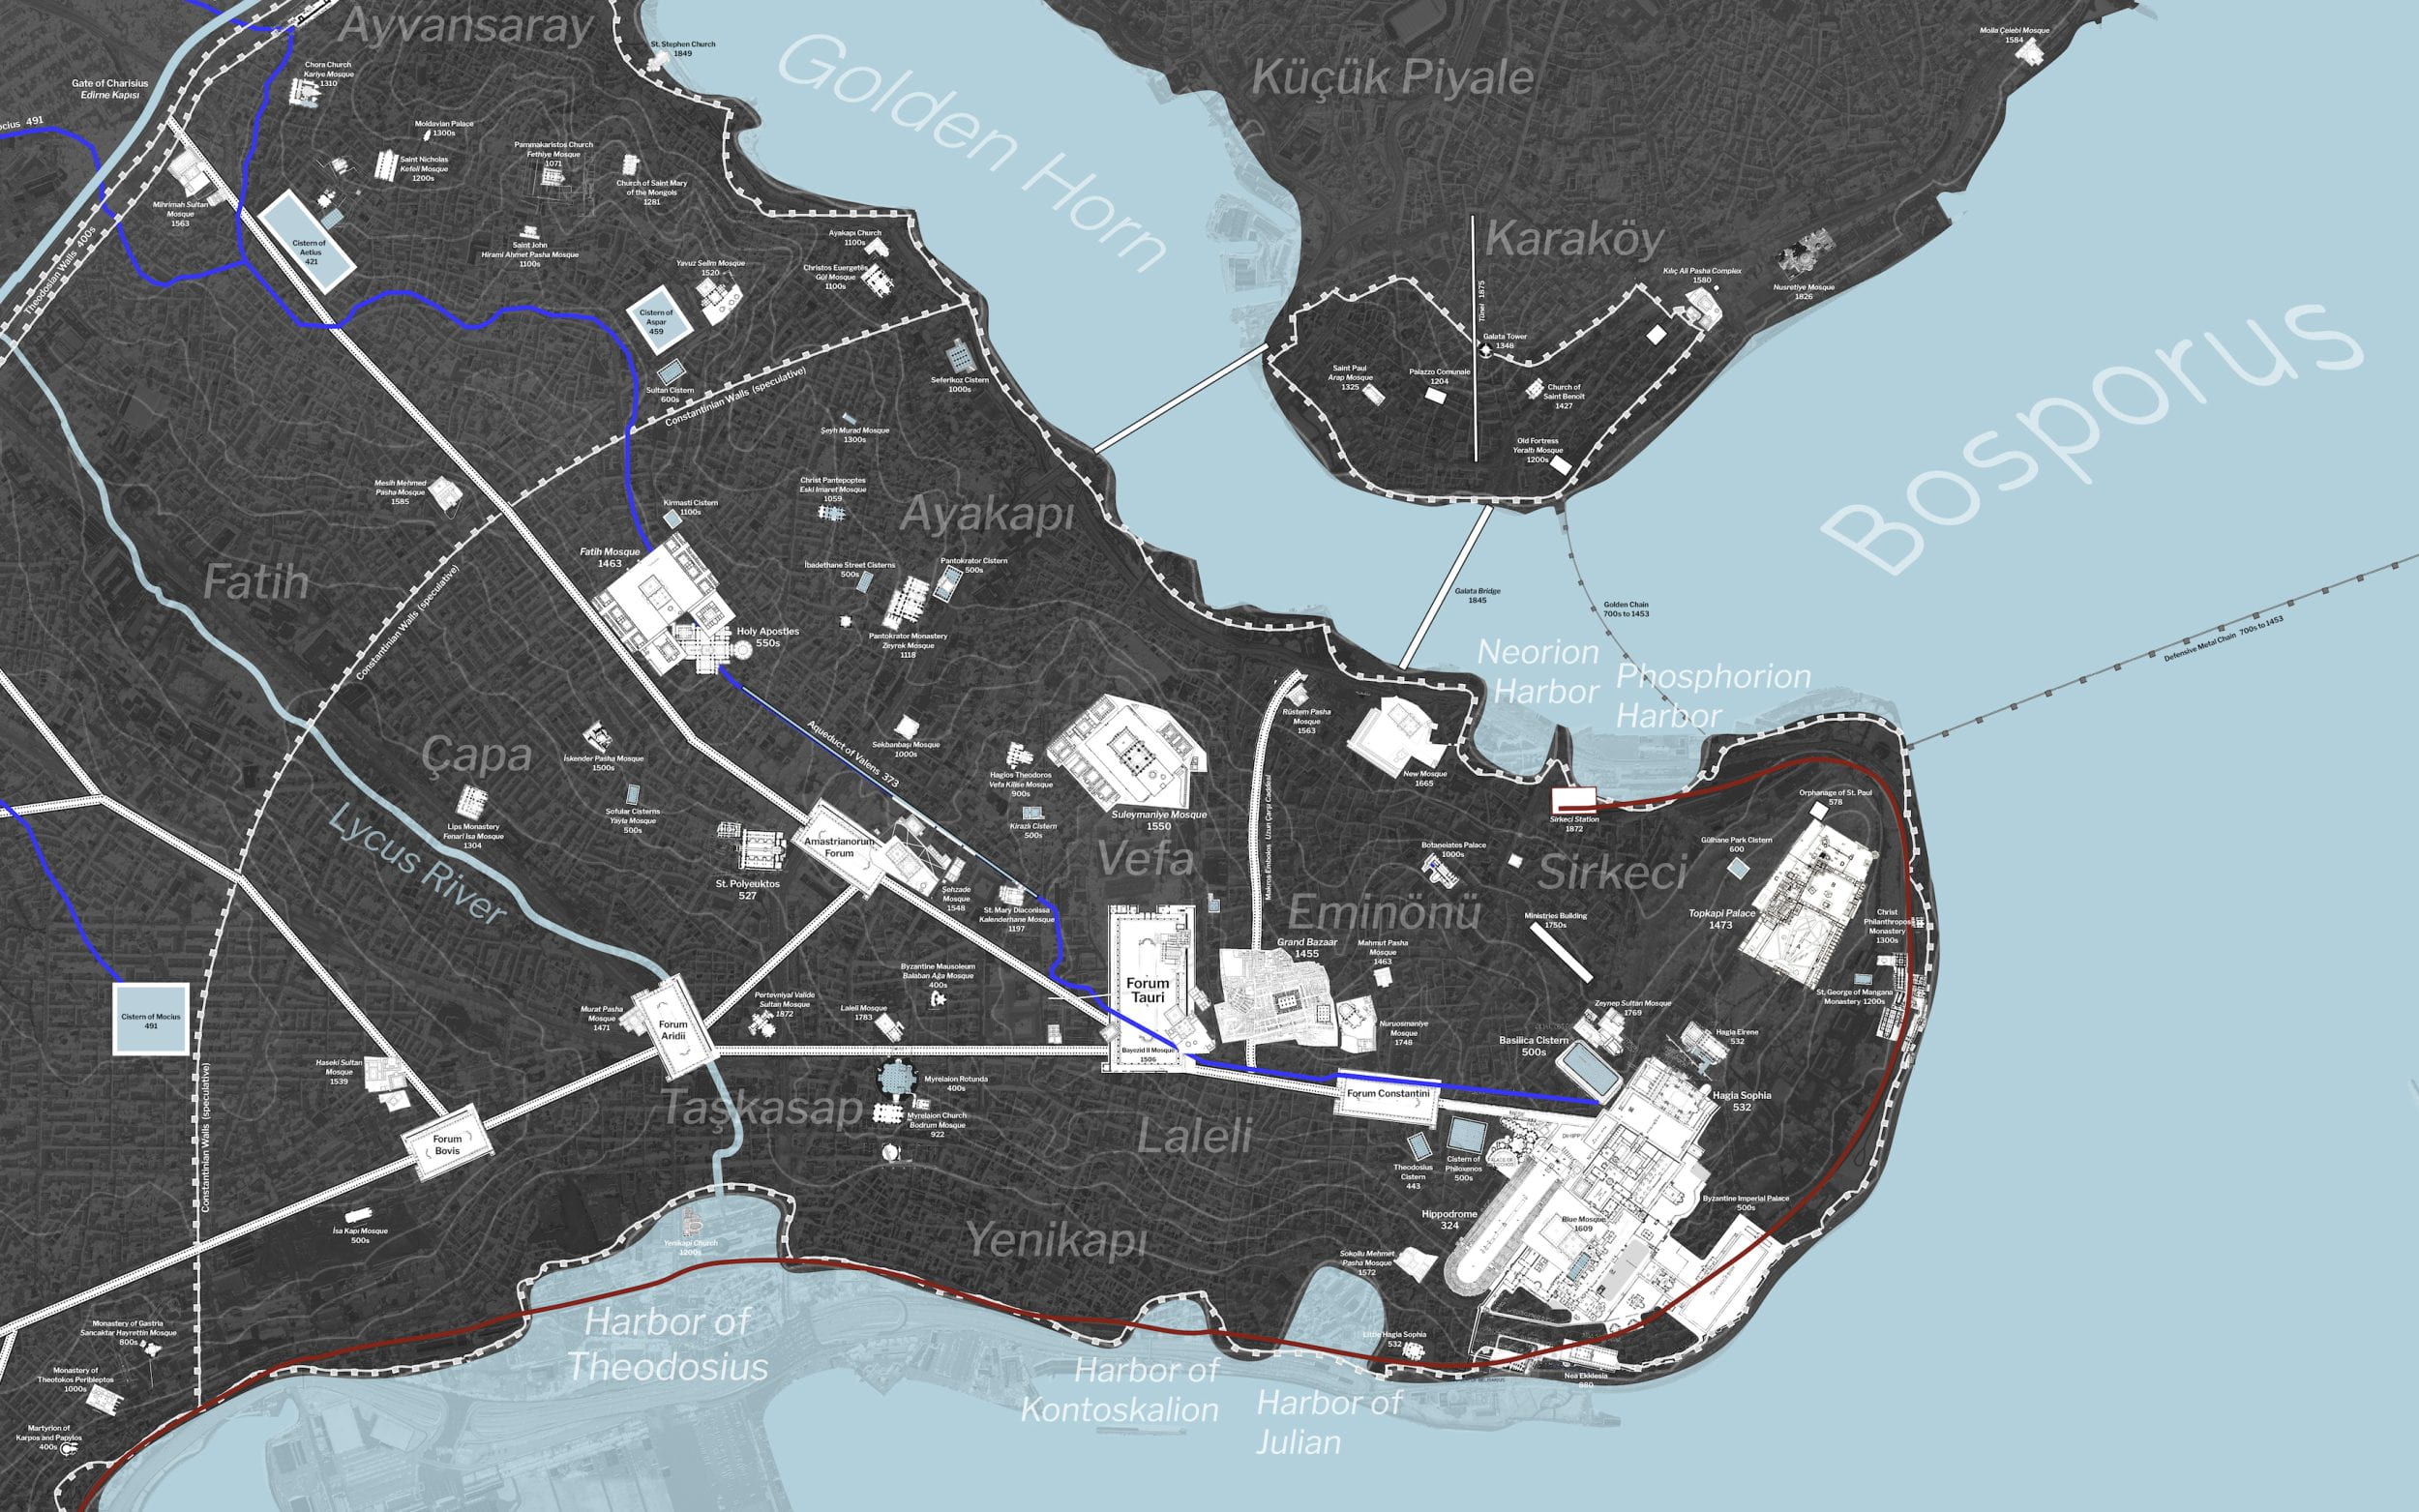
Using the tools of historical cartography and geographic information systems (GIS), this time-lapse animation reconstructs the urban form of Istanbul during key periods of its millennium-long history. All of about 200 known and major archaeological sites are drawn in scaled plans and overlaid above the city’s contemporary geography. The process reveals Istanbul as a city of layers, spanning three key periods of settlement: the age of Byzantine rule and Christianity (330AD to 1453), the age of Ottoman rule and Islam (1453 to 1923), and the emergence of Istanbul as a model metropolis of population fifteen million (1923 to present).
The accompanying soundtrack I assembled echoes the spirit of each age: a Greco-Roman Lute, a Turkish lavta, and then electronic music for the modern age of a now global metropolis. As the Byzantine Empire ends and the Ottoman Empire begins, the sounds of the Greek lute fade to the Turkish lavta. As the Ottoman Empire ends and as Istanbul becomes the modern metropolis of today, the rhythm of an electro-heartbeat punctuates a recording of voices speaking multiple languages on Istiklal Caddesi in Beyoglu.
For each of three eras, the map also overlays the estimated locations of Istanbul coastlines that were – and are – in the process of movement as the city builds new land to support population growth. On the more detailed and labeled static map below, you can zoom in to reveal the plan of each archaeological site. For instance, Christian churches were converted into mosques after the 1453 Ottoman conquest. They are labeled with their original Christian names in bold, their Ottoman re-namings in italics, as well as the date of their original construction. Also shown are the known locations of buried water cisterns and the paths of the two major aqueducts that filled them: the Aqueduct of Mocius (entirely demolished) and the Aqueduct of Valens (still in existence). Other features shown on the map include the topography of Constantinople’s seven hills, neighborhood names (both Byzantine and Turkish), and the speculative locations of the Roman roads (via / mese) that terminated at civic spaces (forums).

.

Research Method and Source Files:

This project uses QGIS and Adobe Illustrator, similar to my time-lapse evolution of New York City’s urban from from 1609 to present. Building plans are sourced from archaeological reports, edited and re-colored to the same scale in Photoshop, and then geo-referenced above the contemporary satellite imagery in QGIS. Labels and final color corrections were then made in Adobe Illustrator. And lastly zoom animations were added with music in the Final Cut Pro software for video editing. To access the geo-referenced maps and building plans behind this project, please email me. I am happy to share them with you.

.

View full size image >

.

Source Maps and Inspirations:

1. David Hendrix, The Byzantine Legacy: Maps of Constantinople, 2016.
Data on key buildings – all surviving Orthodox churches, water cisterns, palaces, main roads, and civic spaces – in ancient Constantinople. Data on building plans and the source for most maps on which this time-lapse film is based.

.

2. Şehri Konstantin, City of Constantine: Mapping the remnants of Byzantine Constantinople, 2020.
Data on key monuments and their coordinate locations in present-day Istanbul.

.

3. Aga Khan Trust for Culture, Archnet, Aga Khan Documentation Center at MIT, 2016.
Source for the majority of building floor plans incorporated as images into this map: https://www.archnet.org/search.

.

4. Media Center for Art History, Columbia University, c.2000. Source for some building plans.

.

5. Wikimedia Commons, Map of Byzantine Constantinople, 2008.

.

6. Notitia Urbis Constantinopolitanae, c.425-550s.

.

6. Lanciani, Rudolfo (cartographer) and Edizioni Quasar (publisher), Forma Urbis Romae, 1901 / 1990.
Inspiration for my maps of Istanbul came from these maps of Rome. This composite map of ancient Rome in a grid of 46 sheets overlays on a single map the various layers of Rome’s 3,000-year history: one color for buildings of Roman date, another for medieval and Renaissance, and a final color for the contemporary city. The name of this map of Rome inspires the name of my project map: Forma Urbis Constantinopolis.

.
.

Audio Sources:

In order of appearance

1. Brian Kay, Oldest Complete Song: “Epitaph of Seikolos” on the Greek Lyre and Har-Mose Lute, 2021.
Ancient Greek music performed on the ancient lute, minutes 7:33 – 11:48.

3. Traditional Turkish Music on the Lavta, 2022.

4. Modern electronic pop and sweet guitar, 2016
█​█By username “frankum” on Freesound.org

5. Istanbul Streetscape on Istiklal Caddesi in Beyoglu, May 2007.

Envisioning Seneca Village

A project by Gergely Baics, Meredith Linn, Leah Meisterlin, Myles Zhang

In collaboration with the Central Park Conservancy and the Institute for the Exploration of Seneca Village History


Email project authors here if you have questions.


As featured in the magazine of Barnard College at Columbia University
As featured by the Central Park Conservancy, the park’s official website


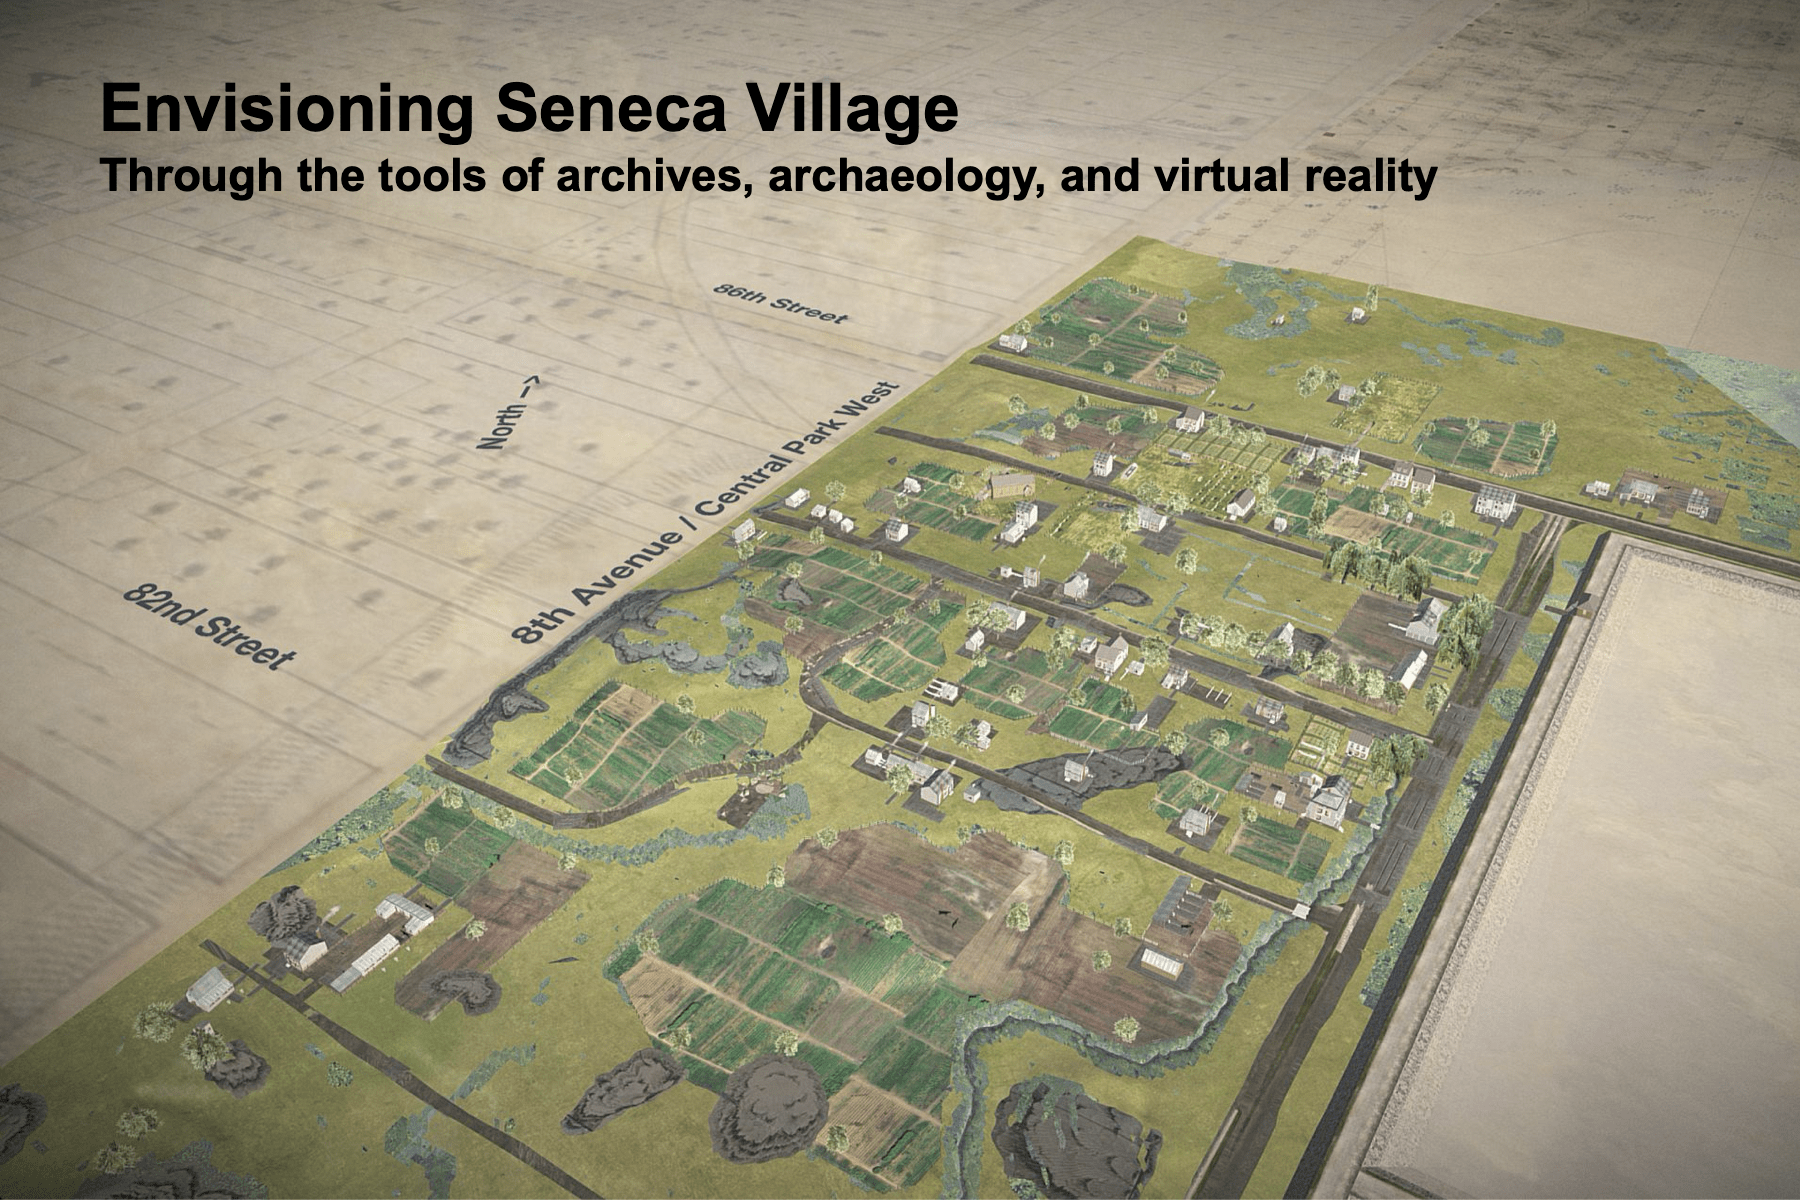
Envisioning Seneca Village depicts what this significant nineteenth-century village might have looked like in the spring of 1855, about two years before it was destroyed by the City of New York to build Central Park. It features an interactive 3D model, a non-interactive tour through the 3D model (A Tour through the Visualization), a printable PDF guide with maps (A Map-based Tour), and supplementary materials. The project is anchored in extensive scholarship and aims to make the village’s history visible to a wide audience.
Seneca Village was a community established by African Americans in 1825, two years before emancipation was completed in New York State. By the mid-nineteenth century, the village was the home of at least 50 families—about ⅔ Black and ⅓ white, mostly Irish. It was situated on an approximately four-block area east of present-day Central Park West between 82nd and 86th Streets, which was then a few miles north of the city’s urban core and between the villages of Bloomingdale to the west and Yorkville to the east. This location offered a safer, freer environment to live than downtown. Villagers built a thriving, complex, and heterogeneous community with core institutions including three churches and a school. Seneca Village’s destruction by the City in 1857 abruptly ended 30 years of successful efforts to nurture families, sustain livelihoods, and create community. It was also the first instance in a long history of the City’s abuse of eminent domain to sacrifice Black neighborhoods for urban development projects—in this case, to build a world-famous park.


3D Model References and Methodology. See also: Tips for Navigating the Model.

As residents scattered to different parts of New York and the Northeast, the Park construction crew buried building debris, covering it with landscaped lawns, hills, and paths. The community’s memory faded for a century and a half. Yet the lives the villagers made there left both an archival paper trail and extensive material traces underground. Since the 1990s historians, archeologists, educators, descendants, and artists have mined the fragmentary sources, excavated the site, and sought new ways to recover the village’s history and memory.
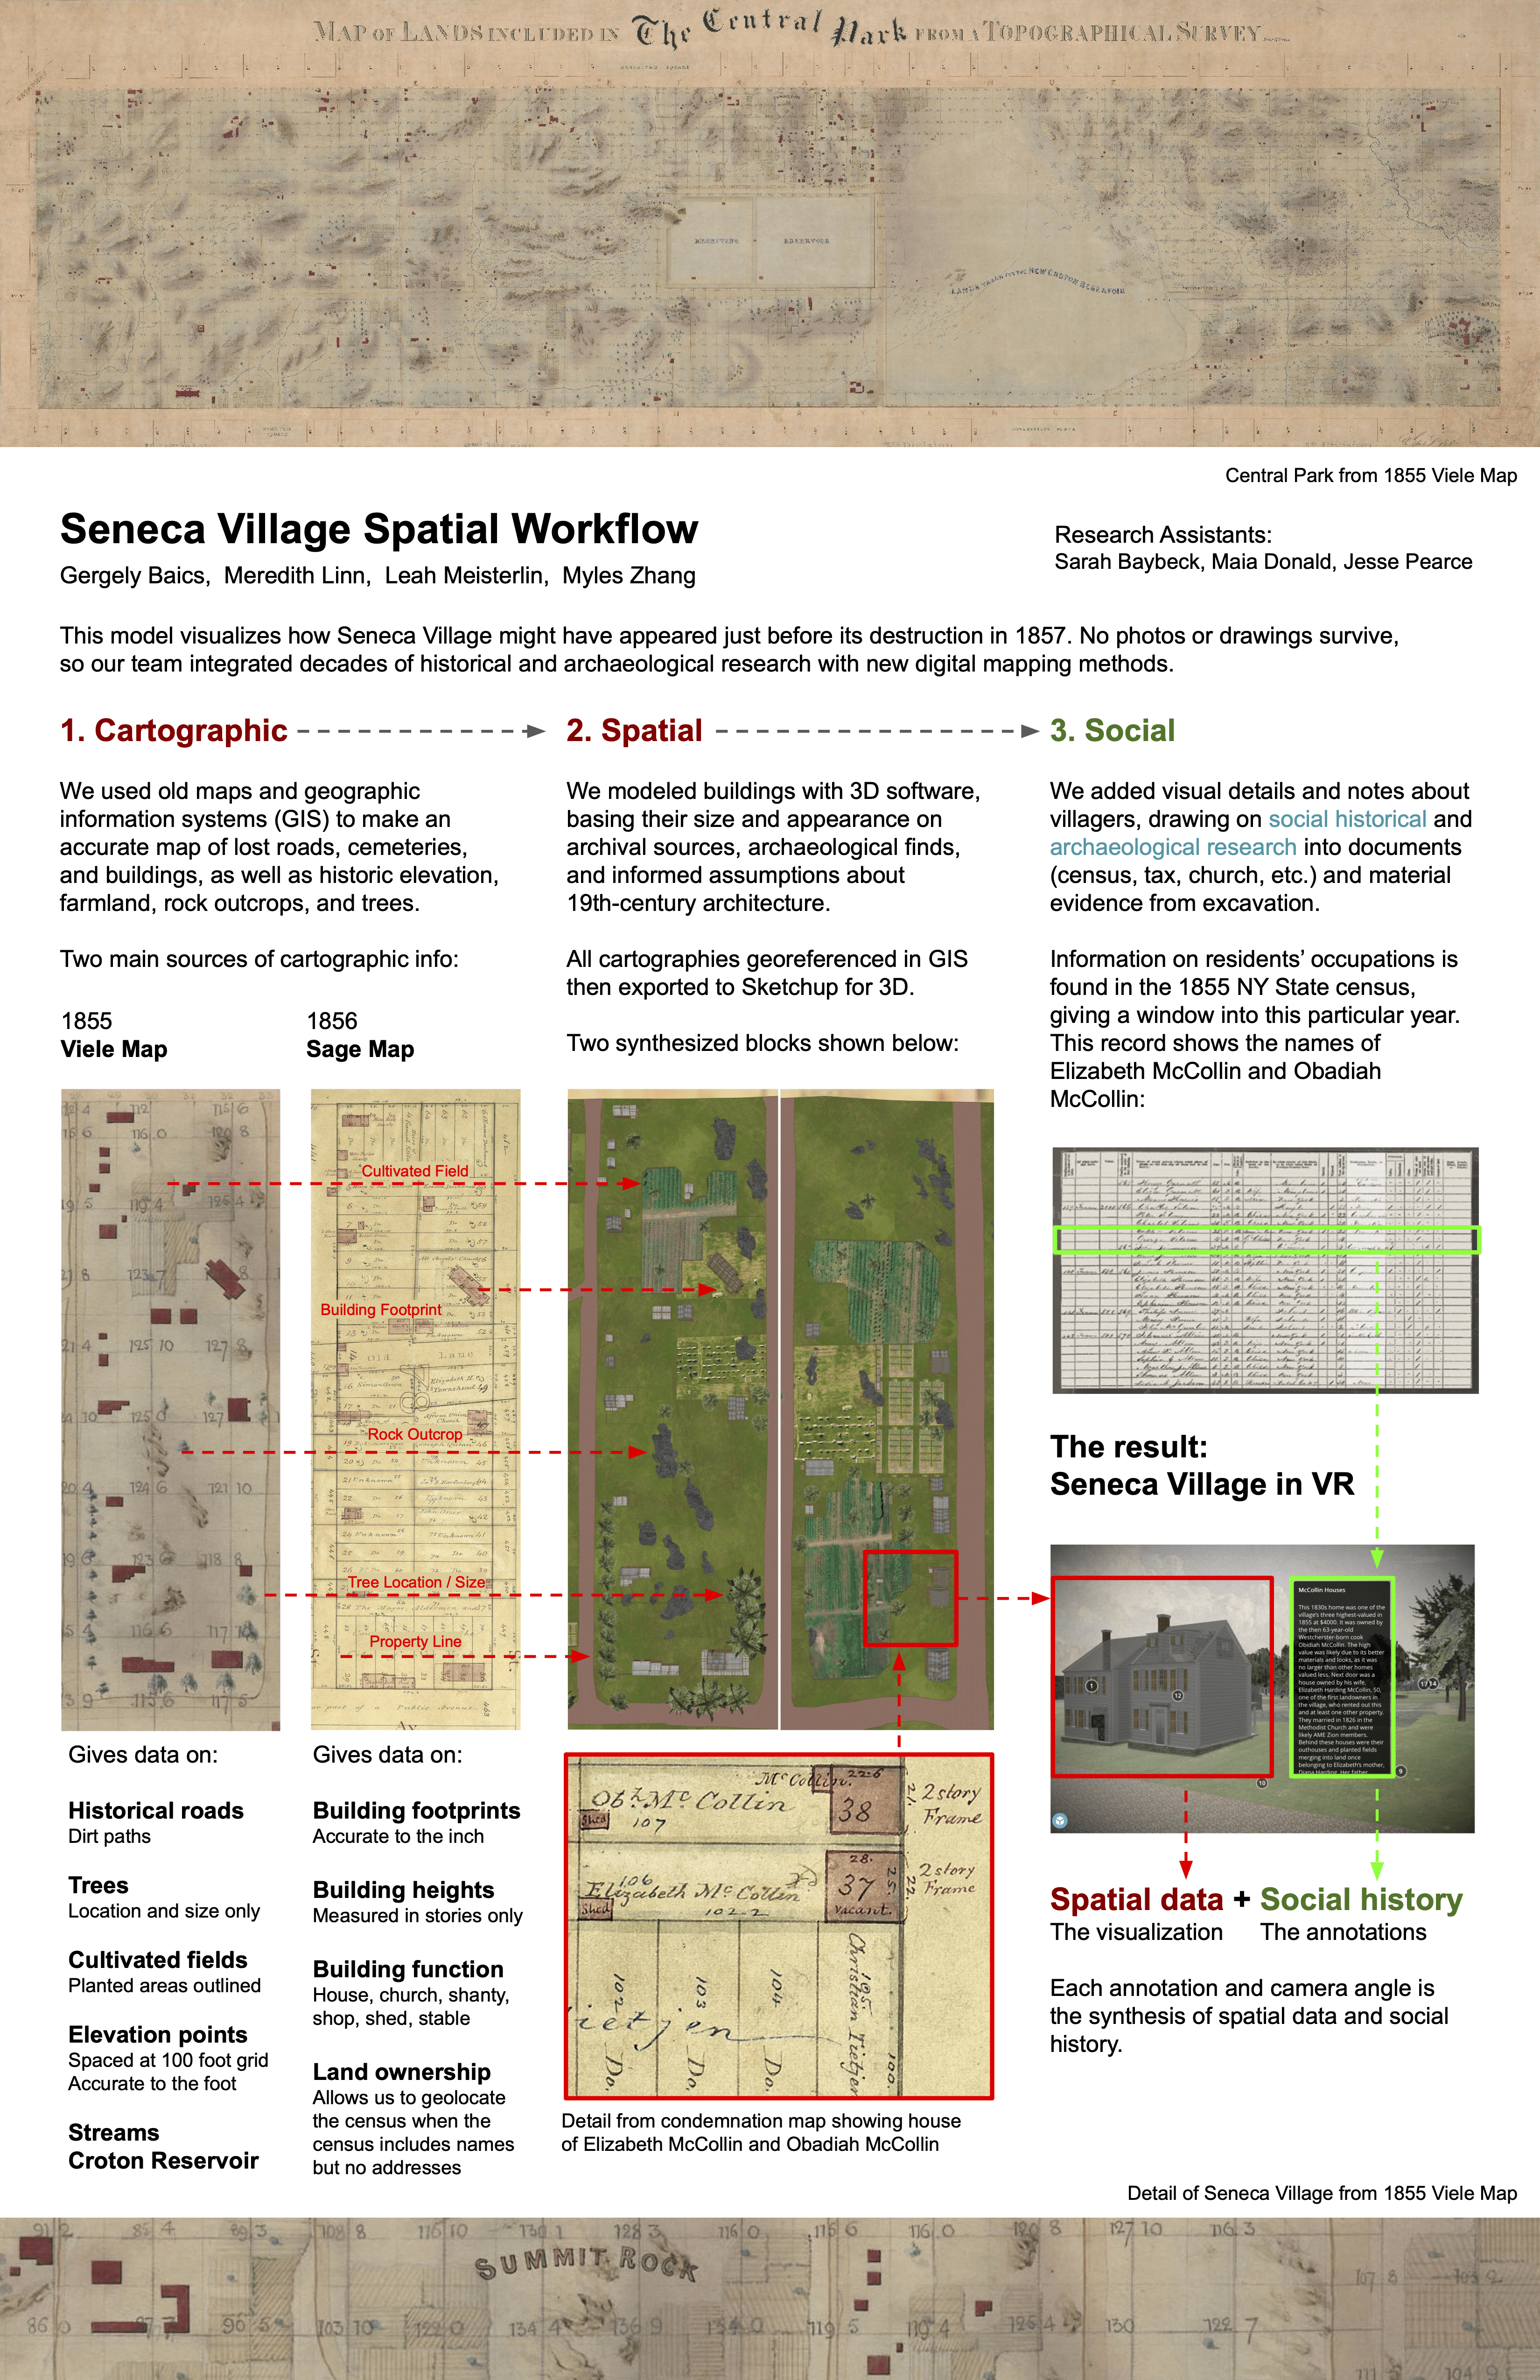
Despite all of the information that researchers have unearthed, there is a lot that is still unknown about the village and its community members. It is hard to imagine what it was like to live there. No photos or drawings survive, the present-day Central Park site is devoid of above-ground traces of Seneca Village’s built environment, and this region of New York City was quite different in the nineteenth century than today. Envisioning Seneca Village addresses these blindspots by creating a visual interpretation of the village that integrates social historical, archival, and archeological evidence into digital cartographic and architectural reconstruction. Through this model we seek to amplify existing scholarship, help visitors to learn more about the village’s history, catalyze new research with the questions the model raises, and above all, keep the memory and spirit of this past community alive in the present.
Envisioning Seneca Village is a collaborative project between Gergely Baics, Meredith Linn, Leah Meisterlin, and Myles Zhang that integrates our expertise in archaeology, social history, historical geographic information systems (GIS), and digital architectural reconstruction. The project has been aided by research assistants, additional support from the Central Park Conservancy, and generous guidance from a diverse group of Seneca Village advisors and stakeholders. Learn more about the project and team.


High-resolution still images provided on the project site (A Tour through Seneca Village).
Printable PDF version of the tour through the Envisioning Seneca Village model, with site maps is live. See “Envisioning Seneca Village: A Map-based Tour.”
To cite the project: Gergely Baics, Meredith Linn, Leah Meisterlin, and Myles Zhang. 2024. Envisioning Seneca Village. Website with interactive 3D model. envisioningsenecavillage.github.io


Project Map Launch

Juneteenth 2024 in Central Park, at the site that was once Seneca Village


Project Workflow

Homeownership and the Racial Wealth Gap

Presented March 5, 2024 at the Newark Public Library

.

.

The world’s largest concentration of wealth is in the New York City metropolitan area, yet the region contains many under-resourced cities, including Newark. What historical factors created this division between low-income Newark and its wealthy neighbors along lines of race, housing, income and social class?
The agents of change are more complex and nuanced than a simple narrative of redlining and white flight following the 1967 uprising. From discriminatory actions by the Federal Housing Administration and highways that carved through the urban fabric, to suburbs that pulled middle-class families away from Newark and factories that relocated outside of the city, contemporary poverty in Newark was more than a century in the making.
Drawing from the archives of the Newark Public Library, this presentation examines the range of challenges Newark faces and how the city overcomes. This is a Newark History Society program, co-sponsored by NJPAC and the Newark Public Library. Light refreshments will be served.
The presenter is Myles Zhang, urban historian and doctoral candidate at the University of Michigan in Ann Arbor.
This presentation will evolve into my dissertation entitled:
“An island of poverty in a vast ocean of material prosperity”:
Homeownerhip and the Racial Wealth Gap in Newark

.

.

.

1959 Map of “Blighted” Areas by Newark Central Planning Board

.

View event on NJPAC website

Jersey City: Urban Planning in Historical Perspective

This project in two parts is a brief history of city planning in Jersey City
and a building-level interactive map of the entire city in 1873, 1919, and today.

.

Read / download book as PDF

Download opens in new window

.

Jersey City: Urban Planning in Historical Perspective
A booklet about the history of the master plan

Over its four-century history, the evolution of Jersey City mirrors the larger history of the New York region. Each generation of Jersey City residents and political leaders have faced different urban challenges, from affordable housing, to clean water, to air pollution, and income inequality. Each generation has responded through the tools of city planning and the master plan.
Jersey City’s six master plans – dated 1912, 1920, 1951, 1966, 1982, and 2000 – capture the city at six historical moments. Reading these plans and comparing them to each other is a lens to understand urban history, and American history more broadly.

.

Classroom Discussion Questions

1. How has the built environment of Jersey City evolved in the past century?
2. Who has the right to plan a city?
3. Who has the right to shape a city’s future?
4. Do you feel you have power over the plan of your city?

Read More

.

Time-lapse History of the United States

This animation visualizes 272,000 data points spanning 220+ years of the U.S. census since 1790. With data from the National Historical Geographic Information System (NHGIS) at the University of Minnesota, I geo-referenced racial dot maps for all ten year intervals since 1790. Overlaying and fading time-lapse cartographies into each other reveals the scale of environmental and urban change.
● Each dot represents 10,000 people.
Top ten largest cities for each decade are labeled in orange.


Musical accompaniment by Philip Glass from the 1982 experimental film Koyaanisqatsi. In the Hopi language of the indigenous peoples of Arizona, the word koyaanisqatsi means “life out of balance.”
As you watch the map, ask:
1. How is the transformation of Indigenous lands into ranches and farmlands made visible in this film?
2. How do immigration and state policies change the built environment? In what ways are immigration and the law visible from the bird’s eye view of this film?
3. How has slavery influenced the demographic landscape and sequential racial dot maps shown in this film?
4. How do changes in transportation technology – in the sequential eras of the canal, the railroad, the highway, the airport, and now the internet – impact how people settle and distribute themselves across the built environment?

.

Sources:

1. Steven Manson, Jonathan Schroeder, David Van Riper, Tracy Kugler, and Steven Ruggles. IPUMS National Historical Geographic Information System: Version 17.0 [dataset]. Minneapolis, MN: IPUMS. 2022. http://doi.org/10.18128/D050.V17.0

2. Social Explorer. https://www.socialexplorer.com/

3. U.S. population over time

4. Top ten largest U.S. cities over time

Newark Changing: Mapping neighborhood demolition, 1950s to today


Click to launch interactive mapping experience.

.

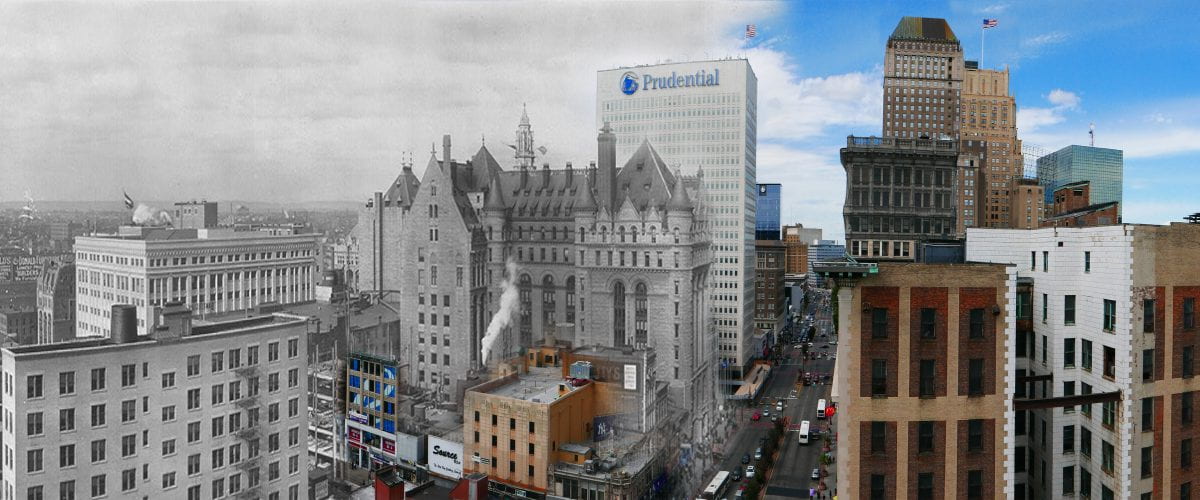
Newark Changing is a first-of-its-kind visual encyclopedia of 2,400 photo comparisons of almost every street corner​​​, home, and building ​​demolished by urban renewal and the social forces behind urban decay.​ Through an interactive and text-searchable historic map, any visitor can travel in time to explore their street and their building as it appeared in the period 1959-68 vs. today. Thousands of old street photos are brought to life with contemporary 360-degree panoramic photos of the same street scenes today, taken from identical camera angles to the old photos. This is the most extensive collection of photo comparisons past and present ever assembled for any American city.
Newark Changing reveals the scale and devastation of urban renewal, not from the aerial perspective of the city planner’s map but from the human perspective of the street corner and neighborhood. Tens of thousands of individual streets, homes, apartments, churches, and Jewish, Black, and Italian-owned businesses in Newark were “redlined” in the 1930s and deprived of investment. Most of these neighborhoods today have been bulldozed for interstate highways, universities, hospitals, and corporate investments in real estate. Billions in taxpayer money (adjusted for today’s value with inflation) was spent in the period 1945 to 1967 to demolish at least 10,000 buildings, displacing 50,000 people, 65-77% of whom were Black. At the same time, the migration of people and jobs away from urban centers deprived cities like Newark of the industrial employment base they once had. Decades after the 1967 rebellion, Newark still struggles to confront and overcome decades of harm inflicted on the city by de-industrialization and population loss to the suburbs.
Street scenes can be browsed by interactive map, by neighborhood, by subject, by street, or by the public institution responsible for demolition. Visitors can thus travel in time to explore today’s empty fields, parking lots, and desolate streetscapes for the vibrant neighborhoods they were before the automobile age.

Launch interactive mapping experience >

Detroit Redlining Map in 1940

A data visualization of urban history and racializing space
Created with urban historian Robert Fishman

.

This map illustrates in three layers some of the impacts of a racist government policy called redlining:
  1. The base map shows the extent of street network development, as well as the locations of important industries, institutions, and urban features in 1940.
  2. The population dot map shows the areas where Black and Whites lived in the segregated city.
  3. The redlining map shows the areas where government and banks chose not to invest, and to therefore deprive people living there of homes.
All three features – the physical city, the urban residents, and the urban policy of redlining – are interlinked. By displaying these three features together, previously invisible aspects of urban history become visible in plain site to the public.

.

.

View project full screen

Opens in new window

.

Data sources:

Topoview from USGS for street network maps
Mapping Inequality Projecct for redlining data
IPUMS at the University of Minnesota for population and race by census tract

.

Created with help from:

Robert Fishman academic mentor
Karl Longstreth from the Clark Map Library at the University of Michigan
Gergely Baics and Wright Kennedy from Columbia History Department
whose project about racializing space in New York City inspired this proposal

Branch Brook Park Interactive History Map

As featured by the Branch Brook Park Alliance as the official park map

.

Navigate this interactive history map of Newark’s Branch Brook Park. Click on map features to learn about park amenities, recreational spaces, and historic features. Map annotations are paired with explanatory texts and comparative photos of past and present. Beneath each annotation is the Google Maps link that will display directions to that point in the park from wherever you are standing.
All historic images are from the archives of the Essex County Parks Department and Newark Public Library. Browse their digital collections or contact the agency to visit their archives. All descriptions are sourced from the Cultural Landscape Report that documented the park’s history and renovation.
Map created by Myles Zhang
Map texts by Linda Morgan, Curtis Kline, Myles Zhang, Maeher Khosla, and Jack Barron
Contemporary photos by Curtis Kline with Mouli Luo

.

Read More

.