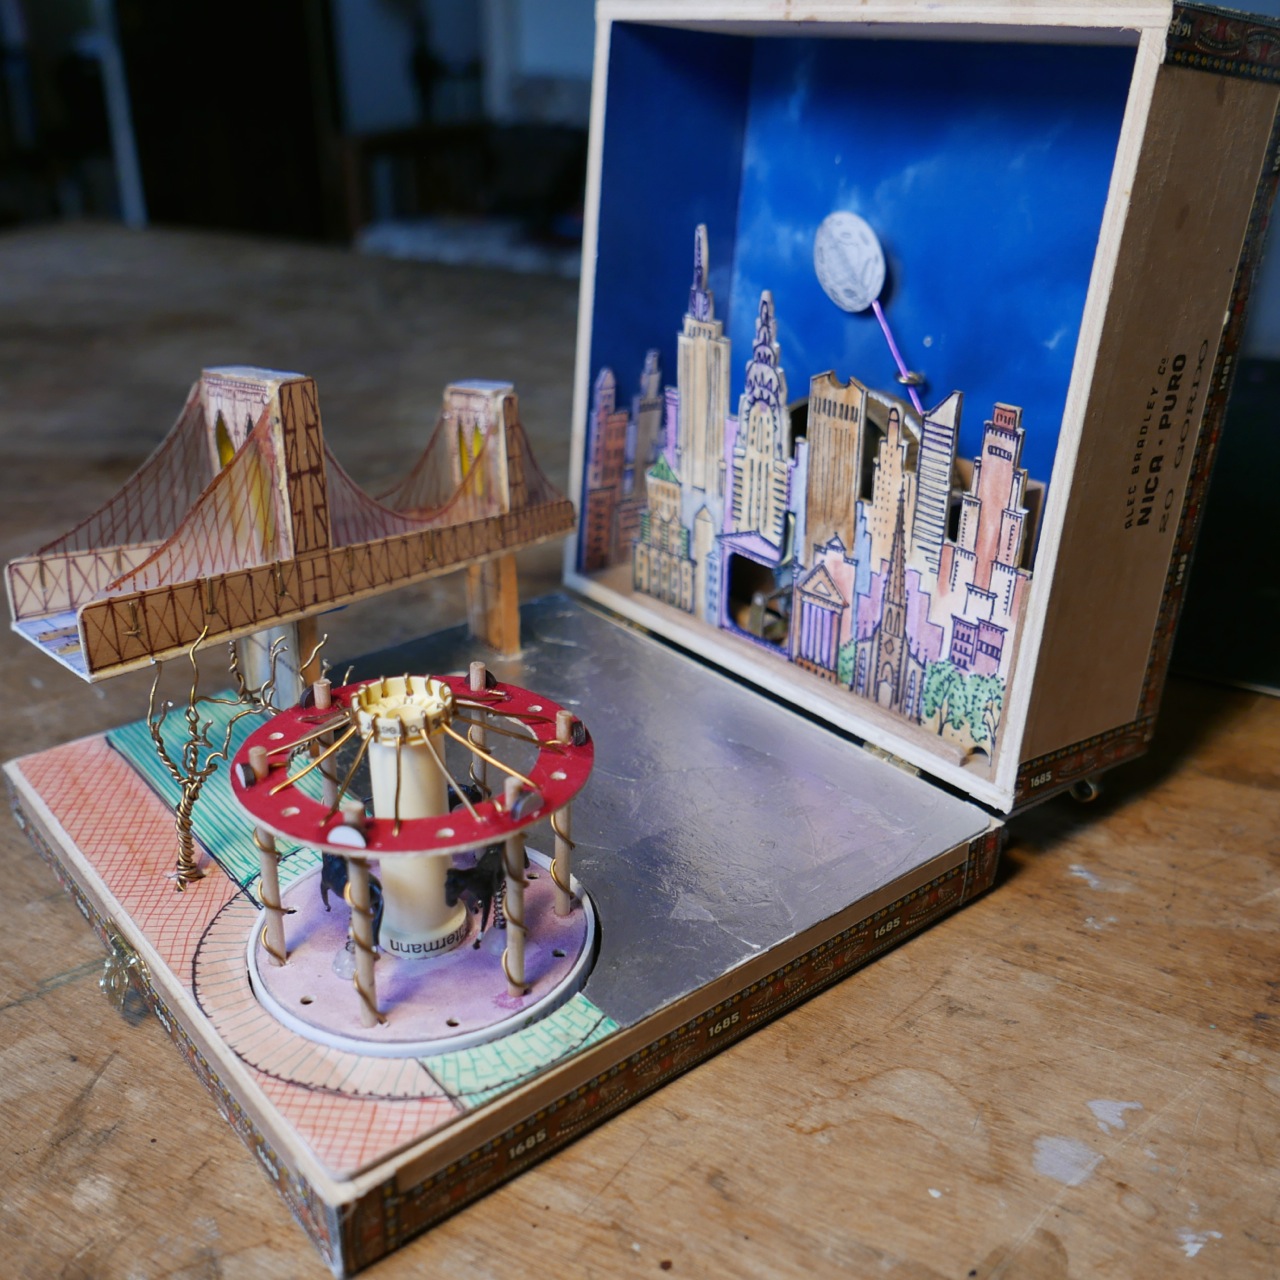
All New York City in one drawing

View full size

Opens in new window

.

The scan above is suitable for viewing but not for large-format printing. Please request access to the full-size scan at ~400dpi

.

This ink on paper drawing represents 800 hours of work over several months. The dimensions are 45 inches high by 79 inches wide (114 cm by 201 cm).
This panorama shows NYC looking northwest from above Governor’s Island and Red Hook. The Statue of Liberty, Ellis Island, and Staten Island are outside the frame. The view is accurate as of summer 2017 and does not include buildings built after this time.
View on Google Earth where this image is taken from.
The image features ~4,493 buildings. For the largest and most important buildings, more attention is paid to detail. All of Manhattan’s bridges and major parks are included. Any buildings excluded were done so because they were either too small, too distant to include, or not visible from the angle this image is taken.

.

Image Inventory

● 1,769 buildings in Manhattan
● 436 buildings in Brooklyn
● 1,072 buildings in Queens
● 76 buildings in Bronx
● 1,140 buildings in New Jersey
● 9 construction cranes
● 25 water features
● 28 churches
● 47 ships
● 56 bridges
● 74 water towers
● 348 cars
One metropolis
5,080 features of the built environment shown

.

.
Riding Professor Kenneth Jackson’s all night bike tour through Gotham’s history inspired this image. Traced in orange below is the route of Jackson’s bike tour: starting at Columbia University’s Low Library, through Central Park, across Midtown to Washington Park, along the Hudson River to Wall Street, and then across the Brooklyn Bridge.

Drawing with route of Kenneth Jackson’s bike tour

.

What gave me the idea for this project?
My goal in ten years is to research and teach about art history and urban studies. Unfortunately, most aspiring professors do not get to choose the city where they work. Because I might not have the privilege of working near New York City, I wanted to draw a keepsake of all my youthful memories and experiences here. I have a photographic memory walking through the city. So I have memories that relate to all the buildings shown. I plan to frame this on the wall above my desk.

.

What was the most difficult part?
Because the image is ink on paper, there is no way to erase a mistake. At the later stages, any slip of the pen might have destroyed several months of work.
I am delighted with the result, but the process was tedious and required drawing thousands of windows. I never counted how many. I could only work a few hours per day before becoming exhausted. I will never attempt a drawing like this again because it is so time-consuming, and I am unlikely to ever find myself trapped again at home for such a long period of time. Fortunately.

.

Has the current pandemic changed how I think about NYC?
The pandemic is forcing me to appreciate NYC from a distance. Even if I am afraid to ride public transit, this drawing – and the experiences it represents – will always be a part of me.
I can see this pandemic slowing down some gentrification and keeping the built environment similar to my drawing for a good few more years. I am just afraid that, with so many businesses closing, the city might emerge from this pandemic unfamiliar to how I remember it in this drawing.

.

Annotated Map

Click red label to view detail area in detail.

.

.

Tour of desolate NYC during Coronavirus

This NYC tour follows the route of Kenneth T. Jackson’s night tour. As a Columbia University undergraduate, I joined Jackson’s 2016 night tour of NYC by bike, from Harlem, down the spine of Manhattan, and over the bridge to Brooklyn.
With a heavy heart, I gathered my courage on 30 March 2020 to revisit my beloved NYC, along this same route in the now sleeping city attacked by an invisible pathogen. The empty streets hit me with emotions in the misty and rainy weather – perhaps fitting for the city’s low morale.

.


.

The tour route is drawn below.  View this drawing in detail.

.

.

Audio effects from Freesound:  Street ambiancehighway ambiancepassing carsiren blastshort sirenlong siren

New York City Water Supply: animated history

Developed with Gergely Baics, urban historian at Barnard College

.

New York City has some of the world’s cleanest drinking water. It is one of only a few American cities (and among those cities the largest) to supply unfiltered drinking water to nine million people. This system collects water from around 2,000 square miles of forest and farms in Upstate New York, transports this water in up to 125 miles of buried aqueducts, and delivers one billion gallons per day, enough to fill a cube ~300 feet to a side, or the volume of the Empire State Building. This is one of America’s largest and most ambitious infrastructure projects. It remains, however, invisible and taken for granted. When they drink a glass of water or wash their hands, few New Yorkers remind themselves of this marvel in civil engineering they benefit from.
This animated map illustrates the visual history of this important American infrastructure.

.

Sound of water and ambient music from Freesound

New York City is surrounded by saltwater and has few sources of natural freshwater. From the early days, settlers dug wells and used local streams. As the population grew, these sources became polluted. Water shortages allowed disease and fire to threaten the city’s future. In response, city leaders looked north, to the undeveloped forests and rivers of Upstate New York. This began the 200-year-long search for clean water for the growing city.

.

Credits

Gergely Baics – advice on GIS skills and animating water history
Kenneth T. Jackson – infrastructure history
Juan F. Martinez and Wright Kennedy – data

.

Interactive Map

I created this animation with information from New York City Open Data about the construction and location of water supply infrastructure. Aqueduct routes are traced from public satellite imagery and old maps in NYPL map archives. Thanks is also due to Juan F. Martinez, who created this visualization.
Explore water features in the interactive map below. Click color-coded features to reveal detail.

.

Watersheds   Subsurface Aqueducts   Surface Aqueducts   Water Distribution Tunnels   City Limits

.

▼ For map legend, press arrow key below.

.

Sources

.
For such an important and public infrastructure, the data about this water supply, aqueduct routes, and pumping stations is kept secret in a post 9/11 world. However, the data presented here is extracted from publicly-available sources online, and through analysis of visible infrastructure features on satellite imagery when actual vector file data or raster maps are unavailable from NYC government.
.
Contemporary Maps
NYC System and Shapefiles – Juan F. Martinez
Watershed Recreation Areas – NYC Department of Environment Protection (DEP)
General System Map – NY State Department of Environmental Conservation (DEC)
.
Historic Maps
.
Texts
Water Supply Fast Facts – NY State DEC
Encyclopedia of the City of New York – Kenneth T. Jackson
.
Animation music – Freesound
Audio narration – Myles Zhang

New York City in a Box

As featured in this article from Live Auctioneers

.

.

.

Inspired by the Stettheimer Dollhouse at the Museum of the City of New York, this pop up model in a recycled metal box (measuring 8 inches wide by 15.5 long and 2.5 deep) reveals a miniature world of New York City architecture and landmarks within. About 30 buildings made from hand cut paper and tin are spread across a flat ground of painted streets. Each building is made from a single sheet of paper that is cut and folded like origami to create different shapes and sizes. A hand cranked lever operates a mechanism of chains and gears hidden beneath the  paper surface of the city streets. These gears move the magnetized trains and airplanes through the city.

.

.


.

Hand-crank and music box recording from Freesound

New York: subway city of immigrants

Golden Rectangles SuperimposedAs northbound Broadway dips down to the valley of 125th Street, the subway soars over the street. The subway viaduct is a jumble of steel slicing through the orthogonal city grid. The 125th Street viaduct is a massive arch, 250 feet from end to end, two hundred tons of mass channeled into four concrete pylons, resting on the solid bedrock of Manhattan schist. The subway is the intersection, where the underground and aboveground worlds of New York City converge.
New York City is now home to a peculiar race of people. Every day, New Yorkers step to the tune of the stoplight. Every day, they ride in sardine can subways. Like smoked ham on the butcher’s hook, they hang from subway straps. At their respective stops, they scramble on to work, home, and family. All New York is a stage, and all the men and women merely players. They have their entrances as subway doors slide open, and they time their exits to the familiar recording of “Stand Clear of the Closing Doors Please.” 1
The subway’s alphabet lines snake their way beneath the city and above the boulevards. Take the to Brighton Beach, the to Jamaica, or the to Forest Hills. From the towers of Midtown, to the factories of Flatbush, to the shouts of Shea Stadium, the subway is a panoply of color, motion, and people. For the price of $2.75, the world is within reach. Chinatown, Poland, Russia, Greece, India, and Italy are all neighborhoods joined by the subway’s umbilical cord. New York is a world unto herself, knit together by bands of black asphalt and steel arteries subway track.
Voice of the City - Joseph Stella, 1922

Voice of the City by Joseph Stella, 1922.

Once wooded island of the Lenape Indians, Mannahatta,2 is now a city of immigrants and refugees: the Irish fleeing famine in 1845, the Germans fleeing Revolution in 1848, the Italians in 1871, and now waves of Czech and Chinese, Dominicans and Mexicans. As the metropolis pulsates in motion, the spirit of the city evolves with each wave of newcomers, who ride her subways, inhabit her humid tenements, and dream of home, family, and future.
In 1856, Walt Whitman published Crossing Brooklyn Ferry. He writes of immigrants and bourgeois businessmen alike, all part of “the simple, compact, well-join’d scheme, myself disintegrated, every one disintegrated yet part of the scheme.” Immigrants are the scheme of the city, the cogs of capitalism, and the human machinery of the metropolis. To each immigrant belongs her place, to each worker his seat, and to each vagabond a place in the breadline. Together they form the metropolis. Whitman also writes:
Others will enter the gates of the ferry and cross from shore to shore,
Others will watch the run of the flood-tide,
Others will see the shipping of Manhattan north and west, and the heights of Brooklyn to the south and east,
Others will see the islands large and small;
Fifty years hence, others will see them as they cross, the sun half an hour high,
A hundred years hence, or ever so many hundred years hence, others will see them,
Will enjoy the sunset, the pouring-in of the flood-tide, the falling-back to the sea of the ebb-tide. 3
Rome is nicknamed the “Eternal City” for its ancient architecture and generations of development. New York, too, is an “Eternal City” of sorts. Its skyscrapers may rise and fall with changing tastes and a growing economy. Yet, in the face of all change to the built environment, immigrants remain the eternal constant that marks time and life in this city: a city with over three million foreign born from all corners of the world; a city whose functioning depends on the legions of immigrant window washers, janitors, and taxi drivers without whom this urban machine would screech to a halt. In 1856, Whitman wrote of a fluid and dynamic city of people in many ways like the New York of today.

.

.

New York, you, too, are home to the injustices and inequalities urban life nurtures. Hart Island, New York’s pauper’s cemetery since 1869, is the final resting place of over a million mostly unknown corpses over 150 years, the tired, the poor, and the huddled masses of immigrant New York. Over a quarter million infants are buried here, each one in an unmarked coffin made of pine, the size of a shoe box. Mass graves are three coffins deep and are buried twenty-five in a row. Nearby Riker’s Island, America’s largest jail, imprisons 10,000 a night awaiting trial in the city’s many courthouses. The South Bronx, with a per capita income $12,500, is a mere mile away from the Upper East Side, with a per capita income over $85,000. The glassy condos of Manhattan are priced at a million plus per piece, but these homes are only made possible by the immigrant workers and janitors paid $10 an hour to sweep the hallways of dust and wipe the windows of grit. Every night, these laborers, too, return to their homes in the gritty outer boroughs. They, too, ride the subway that burrows underground, as generations have before them.
In the 1880s, social reformer Jacob Riis was working on How the Other Half Lives. Through photography, he captured the squalor, darkness, and misery of New York’s impoverished immigrant community. He showed children at work in sweatshops, vagabonds at work collecting the refuse of those more fortunate. He exposed the darkness of another world a few steps from Wall Street and a few miles from the opulent mansions and department stores of Fifth Avenue and Ladies’ Mile. 4 That very same year, on March 26th 1883, the Vanderbilt Family of railroad fortune hosted the largest and most expensive costume ball in New York history, costing six million adjusted for inflation. While the idle rich came dressed as the “Count of Monte Cristo” and “Otho the Barbarian,” the poor slept in squalor a carriage ride away in the Lower East Side. As the New York Sun reported three days later, “[This] festivity represents nothing but the accumulation of immense masses of money by the few out of the labor of the many.” 5

.

.

Though a century has passed since Riis, New York still is a city of social contrasts and economic disparities. Ironically, Jacob Riis’ Lower East Side is now a fashionable community for the upper middle class. All the same, the eternal New York City of immigrants endures in the outer boroughs of Flushing, Queens, Jackson Heights, South Bronx, and Bedfort Stuyvesant. In many regards, their social condition is not too different from Riis’ era. His images of New York testify both to how much and to how little New York has changed. America’s Eternal City still is a place of great injustices, but it is also the place where many of these injustices were first confronted and solved by the city’s activists and artists.
George Tooker depicts the alienation of urban life in his 1950 painting "Subway."

Subway by George Tooker, 1950.

As E.B. White wrote in 1949: “The city is like poetry: it compresses all life, all races and breeds, into a small island and adds music and the accompaniment of internal engines. The island of Manhattan is without any doubt the greatest human concentrate on earth, the poem whose magic is comprehensible to millions of permanent residents but whose full meaning will always remain illusive.” 6 Over 400 years since New York’s founding in 1609 by the Dutch, these words remain true as each generation of Men and Women creates the City in their own image. 7
New York, you have not the tree-lined boulevards of Paris, the tradition and pomp of London, or the antiquity of Rome. However, in your diversity of people, cuisine, and culture, you are something far greater. You are home to a city of strangers, a city of neighborhoods, a city of sound, a city of subways, taxis, and buses flowing from the canyons of Midtown to the quiet bedrooms of Westchester and Park Slope, like rivulets of water. Flow on city, flow with the tide, and glide through the eras. Flow on Isle of Mannahatta for “a hundred years hence,” like a ship anchored on bedrock between two proud rivers.

https://mcnyblog.files.wordpress.com/2013/08/sun-mar-29-1883-critical.pdf

Endnotes

  1. Adapted from “All the World’s a Stage” by William Shakespeare
  2. Before Manhattan was settled by Dutch explorers in 1609, it was known by the local Lenape Indians as Mannahatta.
  3. Crossing Brooklyn Ferry” from Leaves of Grass by Walt Whitman, 1856.
  4. How the Other Half Lives by Jacob Riis, 1890.
  5. The New York Sun, March 29, 1883.
  6. Quoted from Here is New York by E.B. White in 1949.
  7. “So God created mankind in his own image.” Genesis 1:27.

Manufacturing the Picturesque at Central Park

Written with Zeynep Çelik Alexander, historian at Columbia University
Inspired by Elizabeth Blackmar’s inspiring lectures on urban development and Central Park

.

Download this essay as a PDF file

.

Figure 1. Map of completed Central Park in 1873

.

Central Park is not only the major recreational facility of Manhattan but also the record of its progress: a taxidermic preservation of nature that exhibits forever the drama of culture outdistancing nature. Like the [Manhattan] Grid, it is a colossal leap of faith; the contrast it describes – between the built and the unbuilt – hardly exists at the time of its creation.
– Rem Koolhaas, Delirious New York1

.

Koolhaas presents one of the challenges core to Central Park’s construction: the tension between natural and manmade, urban and rural. What sets this park apart from most other parks is its yearning to seemingly become something that it clearly is not: natural. Many other pocket parks in this city incorporate existing topography and trees into their design – yet they are smaller. And from the confines of their interior, the sights and sounds of the city are hard to escape. Central Park succeeds in permitting its visitor to make-believe, at least momentarily, that they have left the city and are immersed in the countryside. The original park contained, for instance, a sheep pasture and barn, a nature preserve called “The Ramble,” and a dairy for urban mothers to buy fresh milk.
The scale of Central Park and the engineering that went into its creation is not unprecedented – architects and engineers have completed far larger infrastructure projects. The New York City watershed, for instance, catches all the rainfall within a 2,000 square mile area, stores this water in 19 reservoirs, and then transports this water up to 150 miles in underground pipes that serve nine million people.2 Central Park, by comparison, was built by some of the same engineers but is a mere three-square-miles of “improved” wilderness. However, what is surprising is the degree to which Central Park’s landscape features seem natural, as if land speculators and developers had chanced upon the park and left it as untouched as they had found it, except framed on four sides by the city grid (figure 5). So successful is this intervention that there is often the popular misconception that it is natural. This Huffington Post article, for instance: “I know that it may come as a shock to some, but New York’s Central Park is not an act of God. It might seem that way, especially in the woodlands, which appear so authentically, well, natural.”3

.

Figure 2. Earthworks projects in 1858, most likely in the vicinity of 72nd Street

.

In the 1857 text entitled “The Plan for the Park,” the project’s landscape architect, Frederick Law Olmsted (b.1822-d.1903), writes that it “seems desirable to interfere with its easy, undulating outlines, and picturesque, rocky scenery as little as possible, and, on the other hand, to endeavor rapidly and by every legitimate means, to increase and judiciously develop these particularly individual and characteristic sources of landscape effects.”4 Olmsted’s claim is a good place to start because it expresses a paradox central to the design. Olmsted’s project “interferes” with the landscape “as little as possible” simultaneously with large-scale efforts to move soil, blast rock, and plant trees that employed – at the height of work – some 4,000 men.5 Around five million cubic feet of rock and soil were blasted and removed from the park. Rem Koolhaas interprets this quote from Olmsted as follows: “If Central Park can be read as an operation of preservation, it is, even more, a series of manipulations and transformations performed on the nature ‘saved’ by its designers.”6
How can we reconcile these two seemingly opposed tendencies in Central Park – natural vs. manmade – when almost all manmade features are disguised as natural? I propose that we can better understand the park by dispensing with the pretense that it is in any way natural.
Central Park presents an unusually refined interpretation of nature. Of the approximately 20,000 trees of 175 species, solidly 60% are non-native to New York.7 Of the seven lakes contained within the park, none are natural to the terrain and are mostly the result of damning existing streams. Of the paths, trails, and roads winding through the park – with curves to match the contours of hills and valleys – none are original, nor do they correspond to pre-development dirt roads and Lenape Indian trails.8

.

Figure 3. Frederick Law Olmsted’s 1857 drawing of the park before and after the planned “improvements.”
The style and content of this image evokes the work of English landscape architects and Humphry Repton.

.

Before work began in 1857, the pre-development topography was insufficient for use as a public park. The Manhattan grid – comprising some 2,000 plus city blocks each measuring exactly 200 feet wide – implies a flat terrain and originally made no accommodations for interfering rivers, hills, or marshes. Looking at a street map of the island, one might be surprised to learn that the terrain rises and falls the length of the island from zero feet at sea level to ~250 feet at its highest peak (figures 4 and 16).9 The name “Manhattan” is a Lenape Indian word that means “Island of Many Hills.”10 Yet, despite the variety of sites planners could have chosen from, the park’s rectangular boundaries were not determined by the availability of topographic features appropriate for a park.

.

Figure 4. British Headquarters Map of Manhattan Island from c.1789. Only the shaded pink section at top of island is developed at city-level density. The rest consists of rolling hills, forest, and farmland that inspired Henry Hudson, the first European who “discovered” the island in 1609, to remark that: “The land is the finest for cultivation that I ever in my life set foot upon.”11

.

Instead of topography, three main factors determined the location: First, planners needed to choose a site close to the expanding city yet far enough away that the land could be acquired cheaply and without displacing large numbers of residents. Second, the city’s population had grown 160% in the twenty years from 1840 to 1860,12 and the city’s existing Croton reservoir (then located in the exact center of the proposed park) was insufficient. The city needed an expanded reservoir; the most convenient location on Manhattan Island for this reservoir was next to the existing one. The otherwise purely practical infrastructure of water supply could thus become a landscape feature.13 Third, the city planned to offset the approximately five-million-dollar price tag of land acquisition and construction through corresponding increases in the taxable property values of land adjacent the park. The architects also went so far as to suggest “a toll of three cents on visitors coming on foot, and six cents for all others” collected on visitors to fund park maintenance and offset construction costs. (This was never implemented.)14 Olmsted also writes:
Land immediately about the Park, the frontage on it being seven miles in length, instead of taking the course anticipated by those opposed to the policy of the Commission, has advanced in value at the rate of two hundred per cent per annum. […] It is universally admitted, however, that the cost, including that of the original off-hand common sense blunders, has been long since much more than compensated by the additional capital drawn to the city through the influence of the Park.15
The park’s location might be strengthened by the simple fact that a linear or smaller park along the waterfront would have fewer miles of frontage of taxable properties adjacent to the park. For instance, locating just one side Central Park along the Hudson and East River (instead of the island’s center) would result in 2.5 miles fewer of abutting properties. Within the following decades, the properties in the Upper East and Upper West Side that overlook the park became (and remain) among the most expensive in the city. This method of development – sacrificing a fraction of the land for park use so as to increase the monetary value of the adjoining lands – was common in New York City (e.g., Gramercy Park) and particularly in London’s fashionable West End and Hyde Park neighborhoods.16 What makes Central Park different, though, is the unprecedented scale of this investment to boost civic pride and to increase property taxes.

.

Figure 5. A c.1836 engraved map of mid-Manhattan with the outline of the future park drawn in orange ink c.1858. The incongruity between the park’s outline and the topography is also illustrated by the fact that the park’s northern boundary (originally at 106th street) would require blasting through a one hundred foot high solid-rock mountain to make way for the perimeter street.

.

Given these priorities – real estate and infrastructure interests over aesthetics – the choice of location was not ideal (figure 5). The rough terrain was mostly barren of trees and was a mosquito-laden wetland. (More readily converted and forested terrain was originally proposed along the East River in the vicinity of Roosevelt University.) Before beginning the architect’s work of planting trees and building scenic garden features, the first major task was to prepare the land and make it suitable for public use. To that effect, Olmsted contracted the engineer (and later military coronel) George E. Waring to drain the swamp. Waring directed 400 men to construct some 105,000 linear feet (32 kilometers) of drainpipes over two years (figure 8).17 His military-style approach toward clearing the park followed him into later life when he became New York City’s sanitation commissioner. As commissioner, he required all his street cleaners to wear white pith helmets (identical to those worn by European colonists in Africa) and then declared the war on filth. Given his interest in sanitation and dislike of dirt, his answer to the park commissioners’ question is revealing:
Commission’s Question: “To what degree shall the park be drained?”
Waring’s Answer: “Totally.”
Q: “By what form of drains?”
A: “Earthenware, of varying calibers.”
Q: “At what depth?”
A: “Three feet in open glades, four feet in forested areas.”
Q: “For best economy, by contract or days’ work?”
A: By days’ work because of the endlessly varied conditions requiring uncommon on-site super vision.”18

.

Figure 6. Buried Pipes in Connection with the New Reservoir, c.1862.

.

Figure 7. General View of North Reservoir from 102nd Street, 23 October 1862.
All the land visible here is now buried beneath the reservoir.

.

Another requirement asked of the planners was to incorporate a new reservoir into the park (figures 6-7 show terrain now flooded beneath reservoir). The existing stone reservoir and Croton Aqueduct, completed 1842, were no longer sufficient19 despite Walt Whitman’s claim that: “Ages after ages these Croton works will last, for they are most substantial than the old Roman aqueducts.”20 To augment the Croton’s capacity, the new reservoirs combined covered approximately 20% of the park’s surface area over terrain that otherwise would have become parkland. Before Olmsted had even submitted his plan in 1857, the engineer Egbert L. Viele, who had been surveying the parkland since 1853,21 had decided on placing this reservoir on a natural depression in the land, to be augmented by an earthen embankment around the perimeter. Olmsted’s final proposal follows the contours of Viele’s proposed reservoir exactly – illustrating the degree to which engineering needs dictated the landscape architect’s choices.

.

Figure 8. Map of drainage system on lower part of the Central Park as far as completed up to 31 December 1858. On the left is 59th Street, 5th Avenue is at bottom, and 8th Avenue (i.e. Central Park West) is at top. This map only illustrates the paths of future carriage roads within the park – that is, the thick white lines that wind through the landscape. Red lines indicate the buried clay pipes that drain water from the marshy soil – and many continue to do so today. Shaded gray areas correspond to areas to be raised with dirt fill. The shaded blotches are for preserved boulders protruding above ground. The slightly off-kilter rectangle in center is for the area drained to create the Central Park Mall – the only geometrically symmetrical part of the park.

.

Although the park was extensively surveyed and re-landscaped there was, nonetheless, an attempt to appear rustic and unkempt. The architect, Calvert Vaux, blanketed the park in little pavilions and bridges made from unpolished and rustic wood with bark still on the beams – a nineteenth-century re-reading of the primitive hut.22 The passage from the southern to the northern reaches of the park was also a parable in the march of civilization and progress. By this time, the city was advancing northward up the island from its historic center in Lower Manhattan (figure 9). Within forty years, the island would be completely built-up. With this recognition of urban sprawl, Olmsted named the park’s 16 original entrances to reflect the city’s movement and types of people living in New York. In order from south to north, the names are as follows: Artisan’s Gate, Merchant’s Gate, Scholar’s Gate, Woman’s Gate, Inventor’s Gate, Miner’s Gate, Mariner’s Gate, Engineer’s Gate, Gate of All Saints, Woodman’s Gate, Boy’s Gate, Girl’s Gate, Stranger’s Gate, Warrior’s Gate, Farmer’s Gate and Pioneer’s Gate. This list almost reads as a list of social classes in increasing order of proximity to raw nature.23 The design features also evolve over distance. The southern reaches (also the busiest section due to the proximity to the city center) was built first and included more pruned botanic features, rectangular parterres of trees, and the proposed flower garden. Olmsted thought it appropriate to leave the northern reaches of the park as wooded as possible with a c.1812 fortress left standing atop a mountain as a picturesque ruin in the style of English garden follies. The northern reaches (also surrounded mostly by farmland at this time) were intentionally more heavily forested, had fewer of the park’s signature bridges, retained the park’s largest rock escarpment, and for the first few decades of its life contained no statues, monuments, or plaques commemorating important people. By contrast, about two dozen monuments to Western Civilization’s great cultural and political leaders (all male) were concentrated in the south: William Shakespeare (installed 1872), Thomas Moore (1879), Alexander Hamilton (1880), Beethoven (1884), Columbus (1894), etc.24 Paradoxically, while the south may appear more refined and cultivated than the north, the pre- development terrains in both sections were equally crafted and manipulated. There is, here, the illusion of moving north toward nature, instead of the reality.

.

Figure 9. The extent of northward marching urban development by 1857, with the park beyond the developed city. Notice how large the park is relative to the city’s surface area, and how the city becomes rural travelling north. View this animation online.

.

At this stage, we might arrive at a better understanding by shifting the descriptive language. Perhaps we should describe the park not in terms of nature or landscape – given that considerations of the natural were not foremost in the design. We might do better to describe the park in terms of infrastructure, engineering, movement, and social class. Indeed, one of the strengths of Olmsted’s proposal – and one of the reasons he won out of the 33 designs submitted – was his decision to separate the park by four different social classes and speeds of movement (figures 10 and 11), each of which corresponded to a width of road and minimum permitted vehicle turning radius (color-coded in figure 12).25 This detailed plan for road separation and drainage were finished before the architects had even begun working on planting diagrams or selecting which species of trees would make for the most varied landscape composition. There were four classes of segregated roads. First, because of the park’s length, size, and location, there would be many vehicles passing through the park, not for leisure, but simply to pass from one side of the park to the other as fast as possible. For these vehicles, the engineers planned four buried transverse roads with entirely separate right-of-way. These straight and wide roads at no point intersected other types of traffic and were entirely below grade level. Second, there were carriage roads for slightly slower carriage traffic within the park. While the relatively straight transverse roads were for practical through-traffic, these carriage roads were for leisure. Third, the next highest speed consisted of a narrower and more curving path than the carriage roads, gravel paths for horseback riders. Horseback riding was a popular leisure and sporting activity – these roads are now largely used for joggers who move faster than pedestrians but slower than vehicles. Fourth, the most ubiquitous road type of all consisted of unpaved footpaths for pedestrians on foot only. With the help of bridges and tunnels (figure 11), at no point did these four systems of conveyance intersect, leading Olmsted to claim: “By this means it was made possible, even for the most timid and nervous, to go on foot to any district of the Park designed to be visited, without crossing a line of wheels on the same level, and consequently, without occasion for anxiety and hesitation.”26

.

Figure 10. Author’s diagram of road types

.

Figure 11. 1862 cross-section of transverse road. Notice how the trees above the road are drawn small, as if to exaggerate the tunnel’s monumentality.

.

WALK          RIDE          DRIVE          TRANSVERSE

Figure 12.

.

Incidentally, these separate and unequal paths also corresponded to different social classes. The wealthiest individuals – those who could afford a carriage, horse, and driver – would implicitly have exclusive use of the carriage roads, while horseback riders had their separate right of way, and service vehicles were segregated below grade. The rest of the public and working classes were restricted to the footpaths, where security guards patrolled the park and prohibited them from loitering, picking flowers, picnicking, or forming large groups. Elizabeth Blackmar and Roy Rozenzweig write: “In the decade after the opening, more than half of those visiting the park arrived in carriages (which less than 5 percent of the city’s population could afford to own, and each day there were elaborate carriage parades in the late afternoon.”27 Yet, disproportionate design considerations and park surface area seems to be given to this minority of users on carriages. We should return here to the fact that city leaders intended this park to boost property values and taxes on the wealthy residents who lived adjacent to the park. It is only natural, then, that the park design should reflect their interests and preferences.

.

.


Figure 15. Map of middle section of the park between the 79th Street and 97th Street transverse roads, the empty area at lower left hand corner is the future site of the Metropolitan Museum of Art. The blue road corresponds to the horseback trail, now jogging path. After starting at the 59th Street entrance and passing through manmade forests, valleys, and tunnels, horseback riders’ visual experience culminated as they circled this manmade reservoir.

.

These maps of the park – color coded by road type – can help us begin to unravel the degree to which the current landscape is manmade. At first glance, the smooth passage of roads and their organic contours may seem effortless, as if they were laid out along existing roads with regards to existing topography. By separating the different grades of traffic by color (figure 14) and upon closer examination, there is a complex and extensive hidden infrastructure beneath these natural appearances (figure 13).

.

Figure 16. 1811 Commissioners’ Plan

.

These maps also reveal a park that is not separate from or opposite to the city, but instead a continuation of the city. A glance at a map of Manhattan reveals two seemingly different philosophies of urbanism, as imprinted through the laying of road networks. Most of the island is covered in the orthogonal 1811 grid (figure 16). This grid gives no consideration to topography, nature, or aesthetics. Then, there is the three square mile area of Central Park with winding and seemingly organic roads. The absence of symmetry and straight lines might lead one to conclude that the park reflects an attempt to harmonize with nature. Existing popular literature commonly situates this park as a reaction to the grid’s perceived faults and excesses. Upon closer examination, this park’s near obsessive attention to detail, its concern with segregated movement, and its reliance on complex (but hidden) infrastructure reveal the park to be a continuation of the 1811 grid’s interest in real estate, property values, and engineering, more than it is a prosaic and romantic reaction to excessive urban growth. This infrastructure is also wrapped up in a coded message about the progress of civilization. The passage from cultivated south to rugged north can read as a condensed representation of the passage from the center of civilization to its undeveloped edges. One should also keep in mind that simultaneous to the construction of Central Park, engineers and developers were at work on the other side of the country clearing the American West for development. Within the following decades, the extent of farmed land would creep westwards on former Indian soil, generally following the paths of railroads toward California. Does the design of Central Park mirror 1860s American society’s belief in the civilizing power of science and technology to tame the wilderness? Alternatively, is Central Park’s design just a matter-of-fact effort to boost the city’s tax revenues, with no moral agenda intentionally encoded in the park design? Such questions might be impossible to answer, given the lack of conclusive evidence.
Now is the time to return to the question we started with: How can we reconcile these two seemingly opposed tendencies – natural vs. manmade? I posit that by describing Central Park in the language of infrastructure and real estate – instead of nature and aesthetics – we can arrive at a more accurate assessment of the park’s origins, objectives, and construction process. Seemingly, the only way to adapt this ill-suited site into a park that fulfilled the nineteenth-century definition of the picturesque was through public works that, upon their completion, effaced almost all traces of the people, trees, and landscape that existed before. The engineering here succeeds insofar as it is invisible and functions as if no manmade intervention had ever occurred. While at work, Olmsted made this prediction on the future of Manhattan Island:
The time will come when New York will be built up, when all the grading and filling will be done, and when the picturesquely-varied rock formations of the Island will have been converted into formations for rows of monotonous straight streets, and piles of erect buildings. There will be no suggestion left of its present varied surface, with the single exception of the few acres contained in the Park.28
The park is an architectural contradiction. On the one hand, its rock formations, hills, and valleys look to a pre-developed and rugged Manhattan in the public imagination, a landscape more fictive than real. On the other hand, the park’s very presence is a testament to the power of real estate interests, engineers, and the water supply board in shaping the city. This tension underlies the landscape features now almost universally praised for their vision, beauty, and harmony.

.

.

List of figures

  1. Lionel Pincus and Princess Firyal Map Division, The New York Public Library, “Map of the Central Park” New York Public Library Digital Collections, http://digitalcollections.nypl.org/items/4e6a6080- 3569-0134-549e-00505686a51c (retrieved 4 May 2019).
  2. Art and Picture Collection, The New York Public Library, “View in Central Park, Promenade, June 1858,” New York Public Library Digital Collections, http://digitalcollections.nypl.org/items/510d47e1- 0fb6-a3d9-e040-e00a18064a99 (retrieved 4 May 2019).
  3. Frederick Law Olmsted and Calvert Vaux (designers); Calvert Vaux (artist), Greensward Plan presentation board with “Present Outlines” (above) and “Effect Proposed” (below): No. 1. From Point A (view at Fifth Avenue entrance), 1858, graphite, wash and white lead on paper, New York Municipal Archives.
  4. Lionel Pincus and Princess Firyal Map Division, The New York Public Library. “Map of New York City and of Manhattan Island with the American defences in 1776,” New York Public Library Digital Collections, http://digitalcollections.nypl.org/items/ee2f1060-d488-0135-3577-67321a8090bc (retrieved 4 May 2019).
  5. David H. Burr (cartographer), Topographical Map of the City and County of New-York and the Adjacent Country (proof impression of center sheet), published by J.H. Colton and Co., New York, 1836, engraving, ca. 1836, the Metropolitan Museum of Art.
  6. Rare Book Division, The New York Public Library, “Pipes in Connection with the New Reservoir,” New York Public Library Digital Collections, http://digitalcollections.nypl.org/items/510d47e3-6289- a3d9-e040-e00a18064a99 (retrieved 4 May 2019).
  7. Rare Book Division, The New York Public Library, “General View of N. Reservoir from 102nd St. October 23, 1862,” New York Public Library Digital Collections, http://digitalcollections.nypl.org/items/510d47e3-6288-a3d9-e040-e00a18064a99 (retrieved 4 May 2019).
  8. Lionel Pincus and Princess Firyal Map Division, The New York Public Library, “Map of Drainage System on Lower Part of the Central Park as far as completed up to December 31st, 1858,” New York Public Library Digital Collections, http://digitalcollections.nypl.org/items/7fe3e680-0c6a-0132-bc3c- 58d385a7bbd0 (retrieved 4 May 2019).
  9. Author’s illustration from Here Grows New York animation, https://youtu.be/f6U7YFPrz6Y?t=226 (retrieved 5 May 2019).
  10. Author’s diagram of road types
  11. Calvert Vaux (architect), W.B. Swan (delineator), and Sarony, Major, and Knapp (lithographers), Bridge “E” over Transverse Road No. 2, 1861, lithograph, from Fifth Annual Report of the Board of Commissioners of the Central Park, January 1862, the Metropolitan Museum of Art.
  12. “Map of the Central Park” New York Public Library Digital Collections, 1873, modified by author with blue, red, and green color-coding.
  13. “Map of Drainage System on Lower Part of the Central Park as far as completed up to December 31st, 1858.”
  14. 1873 map of Central Park, color-coded by author to indicate types and widths of roads
  15. Ibid.
  16. Manuscripts and Archives Division, The New York Public Library, “Plan of Manhattan Island,” New York Public Library Digital Collections, http://digitalcollections.nypl.org/items/26e27e80-be8a-0131- bf1a-58d385a7bbd0 (retrieved 4 May 2019).
  17. Irma and Paul Milstein Division of United States History, Local History and Genealogy, The New York Public Library, “Central Park Tunnel,” New York Public Library Digital Collections, http://digitalcollections.nypl.org/items/a44288b4-9bdc-b31f-e040-e00a18060314 (retrieved 5 May 2019).
  18. Rare Book Division, The New York Public Library, “Men standing on Willowdell Arch,” New York Public Library Digital Collections, http://digitalcollections.nypl.org/items/94b7acd9-dc81-74f7-e040- e00a18063585 (retrieved 5 May 2019).

.

Works cited

  1. Rem Koolhaas, “Prehistory,” in Delirious New York (New York: The Monacelli Press, 1994), p.21.
  2. Kenneth Jackson, Lisa Keller, et al., “Water Supply,” in The Encyclopedia of New York City (New Haven: Yale University Press, 2010), p.1381-86.
  3. Charles A. Birnbaum, “The Big Task of Managing Nature at New York’s Central Park,” The Huffington Post, 12 September 2012, https://www.huffpost.com/entry/an-unlimited-range-of-rur_b_1870450? (retrieved 15 May 2019).
  4. Kenneth Jackson and David Dunbar (editors), “Selected Writings on Central Park, Frederick Law Olmsted (1858, 1870),” in Empire City: New York through the Centuries, (New York: Columbia University Press, 2002), p.279. This anthology of urban history assembles various primary sources from across NYC history into a single book.
  5. Ibid., “Central Park,” p.222-24.
  6. Rem Koolhaas, Delirious New York, p.23.
  7. Robert Demcker, “Central Park Plant List and Map Index of 1873,” published by the Frederick Law Olmsted Association and The Central Park Community Fund, 1979.
  8. Concluded from comparing maps of the park pre and post construction.
  9. Hilary Ballon, “Introduction,” in The Greatest Grid: The Master Plan of Manhattan 1811-2011 (New York: Columbia University Press, 2012), p.13-15.
  10. Eric Sanderson et al., The Welikia Project, https://welikia.org/about/how-it-all-began/ (retrieved 15 May 2019). – Sanderson created the most detailed visualization of Manhattan’s pre-development topography.
  11. “Early Descriptions of New Netherland,” New Netherland Institute: Exploring America’s Dutch Heritage, https://www.newnetherlandinstitute.org/history-and-heritage/additional-resources/dutch-treats/early-impressions-of- new-netherland/ (retrieved 15 May 2019).
  12. “NYC Total and Foreign-born Population 1790 – 2000,” NYC Planning Department, https://www1.nyc.gov/site/planning/data-maps/nyc-population/historical-population.page (retrieved 15 May 2019).
  13. The old rectangular shaped Croton Reservoir covered 8% of the park’s area. The new reservoir covered about 12%. Combined they covered 20%. Values calculated by author using Google MyMaps.
  14. Frederick Law Olmsted and American Social Science Association, Public Parks And the Enlargement of Towns: Read Before the American Social Science Association At the Lowell Institute, Boston, Feb. 25, 1870, (Cambridge: Printed for the American Social Science Association, at the Riverside Press, 1870), p.35. https://catalog.hathitrust.org/Record/008726621 (retrieved 4 May 2019).
  15. Ibid., p.35.
  16. Jon Campbell and Christopher Robbins, “The Origin Story Of Gramercy Park Is A Classic NYC Tale Of Real Estate Hucksterism, Cronyism, And Gate Crashing,” The Gothamist, 28 June 2018, http://gothamist.com/2018/06/28/gramercy_park_history_amazing.php (retrieved 15 May 2019).
  17. Morrison H Heckscher, “Creating Central Park,” The Metropolitan Museum of Art Bulletin, New Series, 65, no. 3 (2008): p.40, http://www.jstor.org/stable/25434142 (retrieved 15 May 2019).
  18. Ibid.
  19. A mere 94 years after opening, the old Croton reservoir was deemed inadequate, drained of water, and filled with debris from subway excavations.
  20. “Murray Hill Reservoir, November 25, 1849, Walt Whitman,” in Empire City, p.207.
  21. “Creating Central Park,” p.18.
  22. Patricia Heintzelman for the U.S. Department of the Interior, Central Park Nomination Form for NRHP, 1966, https://npgallery.nps.gov/AssetDetail/NRIS/66000538 (retrieved 15 May 2019).
  23. To my knowledge, the claim that Olmsted named the gates in 1862 to mirror the transition from civilization to nature has never been made before. However, Olmsted describes in writing how the terrain should evolve from smooth to rough during the passage north; it follows for naming conventions to reflect this shift.
  24. Wikipedia assembles lists of monuments, parks, streets, etc. organized as metadata with lat-long coordinates. Plotting these coordinates on a map and eliminating recently added monuments reveals a clear spatial concentration of artwork and sculpture in the south. https://en.wikipedia.org/wiki/List_of_sculptures_in_Central_Park (retrieved 16 May 2019). Identical list also found from NYC Parks Department: https://www.nycgovparks.org/parks/central- park/monuments (retrieved 16 May 2019).
  25. Landmarks Preservation Commission, Central Park Designation Report for the NYC Planning Department, 1974, http://s-media.nyc.gov/agencies/lpc/lp/0851.pdf (retrieved 15 May 2019).
  26. “Selected Writings on Central Park, Frederick Law Olmsted (1858, 1870),” in Empire City, p.281.
  27. “Central Park,” in The Encyclopedia of New York City, p.223.
  28. “Selected Writings on Central Park, Frederick Law Olmsted (1858, 1870),” in Empire City, p.279.

Architecture of Exclusion in Manhattan Chinatown

Originally published in the 2018-19 edition of the Asia Pacific Affairs Council journal with help from Seeun Yim at Columbia University’s Weatherhead East Asian Institute, pages 18-20

.

Canal and Mott Street

In 1882, the Chinese Exclusion Act restricted Chinese immigration to the US, prohibited Chinese females from immigrating on grounds of “prostitution,” and revoked the citizenship of any US citizen who married a Chinese male. The consequences of this xenophobic legislation motivated Chinese immigrants to flee racial violence in the American West and to settle in Manhattan’s Chinatown. With a population now of around fifty thousand (2010 census), this remains the largest ethnically Chinese enclave in the Western Hemisphere.

Barbershop Row on Doyers Street

Thanks to New York’s geographic location as a port city with high industrial employment and easy connections to the American interior, this city became the primary point of entry for waves of immigrant groups in the nineteenth century: Irish, Germans, Italians, and Eastern Europeans. What makes the Chinese different, though, is the survival and resilience of the immigrant community they created. Other immigrant groups – namely the Germans and Irish – converged around large neighborhoods and surrounded themselves with familiar languages and businesses. Of these enclaves, all have since disappeared. The children of these first-generation immigrants successfully assimilated into American society, earned higher incomes than their parents, and therefore chose to disperse to non-immigrant neighborhoods with better housing stock and schools. Yet, the Chinese remained.
The resilience of this community results from a confluence of factors: cultural, geographic, and political. Of innumerable immigrant groups to the US, the Chinese were among the only to have the most restrictive laws placed on their immigration. This stigma drove them toward three types of low-paid labor – with which white Americans still deeply associate with the Chinese – laundries, restaurants, and garment manufacturing. Like the Chinese, other groups – particularly Irish-immigrant females – began working in these professions, but they soon climbed the social ladder.

Mosco Street and Mulberry Bend

As an architectural historian, I see that the political and racial agenda of exclusion is imprinted in the built environment of Chinatown. To present this neighborhood’s geography: For most of its history, Chinatown was bordered to the north by Canal Street, to the east by Bowery, and to the South and West by the city’s federal courthouse and jail. The center of this community lies on the low wetland above a filled-in and polluted lake called the Collect Pond. Historically, this area contained the city’s worst housing stock, was home to the city’s first tenement building (65 Mott Street), and was the epicenter for waterborne cholera during the epidemics of 1832 (~3,000 deaths) and again in 1866 (1,137 deaths). The city’s first slum clearance project was also in Chinatown to create what is now present-day Columbus Park.
Race-based policies of exclusion can take different forms in the built-environment. The quality of street cleaning and the frequency of street closures are a place to start. Some of the city’s dirtiest sidewalks and streets are consistently located within Chinatown – as well as some of the most crowded with street vendors, particularly Mulberry and Mott Street). Yet, as these streets continue northward above Canal Street, their character changes. The street sections immediately north in the enclave of Little Italy are frequently cleaned and closed for traffic most of the year to create a car-free pedestrian mall bordered by upscale Italian restaurants for tourists. The sections of Mulberry Street in Chinatown are always open to traffic and truck deliveries.

Grocery Store at Bayard and Mulberry Streets

Unequal treatment continues when examining the proximity of Chinatown to centers of political power and criminal justice. Since 1838, the city’s central prison (named the Tombs because of its foreboding appearance and damp interior) was located just adjacent to Chinatown. The Fifth Police Precinct is also located at the center of this community at 19 Elizabeth Street. Although Chinatown was ranked 58th safest out of the city’s 69 patrol areas and has a crime rate well below the city average, the incarceration rate of 449 inmates per 100,000 people is slightly higher than the city average of 443 per 100,000. This incarceration rate is also significantly higher than adjacent neighborhoods like SoHo that have a rate well below 100 per 100,000. NYC Open Data reveals this neighborhood to be targeted for certain – perhaps race-specific and generally non-violent crimes – like gambling and forgery. Over half of all NYPD arrests related to gambling are in Manhattan Chinatown. Similarly, the only financial institution to face criminal charges after the 2008 financial crisis was Chinatown’s family-owned Abacus Federal Savings Bank – on allegations of mortgage fraud later found false in court by a 12-0 jury decision in favor of Abacus. Abacus provided mortgages and unconventional financial services to the kinds of immigrants traditionally locked out of the banking system, and therefore denied the means to climb the social ladder. The mistreatment of the Chinese in America both past and present is part of a larger anti-China agenda.
When it comes to tourism, Americans seem to have a paradoxical relationship with Chinatown’s “oriental” culture and cuisine. On the one hand, there is a proclaimed love of East Asian cuisine and art, as evidenced by the profusion of Asian-themed restaurants for tourists, or as evidenced by the phenomenon in art history for western artists (and particularly French Impressionists) to incorporate decorative motifs from East Asian woodcuts and ceramics into their work. On the other hand, there is simultaneously exclusion of the people who created this Chinese food and art from political power and social mobility. Still today, Americans seem to want competitively priced Chinese products without suffering the presence of the foreigners who produced these products.

Forsyth and Delancey Street

Let us clarify one thing: The division in Chinatown is not “apartheid” in the strict sense. It is perhaps a division more subtle and difficult to notice. It expresses the kind of unequal treatment – antiquated housing, crowded conditions, and municipal apathy – that face many immigrant groups in America. The built environment of Chinatown is something altogether more complicated and layered with other ethnic groups, too. For instance, the Church of the Transfiguration in the center of Chinatown now has a majority Asian congregation, even though it was founded in 1815 as a German and Lutheran church. Similarly, some of the funeral parlors on Mulberry Bend have Italian origins and old Italian men in the funeral bands.  This neighborhood is also in the active process of gentrification with rising rents pushing out older Asian businesses.
If and when the Chinese become fully integrated into American society, how should the architectural fabric of this immigrant enclave be preserved, considering that its very existence is a marker of race-based exclusion and the century-long challenge of the Chinese in America?

.

This time-lapse of Manhattan Chinatown took sixty hours to complete and measures 26 by 40 inches. Chinatown’s tenements are in the foreground, while the skyscraper canyons of Lower Manhattan rise on top. This shows the area of Chinatown bordered by Bowery, Canal Street, and Columbus Park.

.

Chinese music: Feng Yang (The Flower Drum)

Railroad commuting patterns in New Jersey

View my data visualizations of New Jersey’s suburban growth here.
Created with data from NJ Transit on weekday and weekend rail ridership.
Or download my data from Tableau Public.
NJ Transit carries over 90,000 commuters per day to and from New York Penn Station, the busiest rail station in the Western Hemisphere. The construction of this rail network in the nineteenth and early twentieth centuries was focused around New York City. Like spokes on a wheel, these rail lines radiate from the urban center.
Hover over stations to view statistics. Dot color corresponds to train line. White dots are for stations where multiple lines intersect. Dot size corresponds to number of riders per day: Large dots for busy stations and small dots for less busy stations. For each station, the average number of daily riders is listed.

.

.

The map above shows weekday ridership patterns. Movement is centered around the employment hubs of Newark and New York Penn Station. The next two busiest stations are Secaucus Junction and Hoboken, but these two stations are not destinations. Instead, they are transfer points for commuters en route to New York City. Commuters collected from stations on the Pascack Valley, Bergen County, and Main Line are almost all headed to New York City, but they must transfer at Secaucus (to another NJT train) or at Hoboken (to PATH / Hudson River ferries).

.

.

This map shows Sunday ridership. On average, stations are 66% to 75% less busy on weekends. The thirteen stations along the Montclair-Boonton Line – between Bay Street and Denville – are also closed on weekends because ridership is so low. However, the only line that is almost as busy on weekends as it is on weekdays is the Atlantic City Line. This is likely because trains on this line serve weekend tourists to the New Jersey Shore and Atlantic City casinos.

.

.

Notice the large difference between the first four stations and all others listed. Keep in mind that a lot of this data double-counts a single passenger. For instance, someone riding from their home to work will be counted once in the morning, and again in the evening.

.

Writing Here Is New York in 1949, American writer E.B. White has this to say about suburban commuters:

.

“The commuter is the queerest bird of all. The suburb he inhabits […] is a mere roost where he comes at day’s end to go to sleep. Except in rare cases, the man who lives in Mamaroneck or Little New or Teaneck, and works in New York, discovers nothing much about the city except the time of arrival and departure of trains and buses, and the path to a quick lunch. […] About 400,000 men and women come charging onto the Island each week-day morning, out of the mouths of tubes and tunnels. […] The commuter dies with tremendous mileage to his credit, but he is no rover. […] The Long Island Rail Road alone carried forty million commuters last year, but many of them were the same fellow retracing his steps.” (p.18-21)

Geography of Marijuana Arrests

Update March 2021: Marijuana is now legal in NY state.


.

The New York Police Department (NYPD) made 102,992 arrests in 2017 for the possession, sale, and/or use of marijuana. 1 While only 25.5% of New Yorkers are Black, 67.5% of marijuana arrests are of Blacks. Similarly, 90% marijuana arrests are male, even though only 65% marijuana users are male. 2 Males more than females and Blacks more than others are arrested for marijuana in disproportionate numbers.

.

Race
Percentage of New Yorkers who identify as this race 3
Percentage of marijuana arrests of individuals belonging to this race
White
44.0%
11.2%
Black
25.5%
67.5%
Asian/Pacific Islander
12.8%
4.2%
Other
17.7%
17.1%

.


.

2017 data

.

Click table to view in detail

NYPD marijuana arrests are disproportionately of Black males between the ages of 18 and 44 from low-income communities, even though this demographic represents less than 10% of the city’s population. Why should this matter? Arresting individuals for using a relatively harmless and non-addictive drug is expensive for taxpayers. According to the Drug Policy Alliance, the city spends $75 million on marijuana arrests and prosecution per year. 4 This is money that could have gone to education, parks, and community programs. Marijuana policy targets our country’s poorest people of color.
The common argument, and the grounds on which marijuana was initially made illegal, is that marijuana is a “gateway drug.” Marijuana supposedly introduces and later encourages individuals to experiment with more dangerous and addictive substances. Whether or not this is true, the arrest and punishment of individuals for marijuana may incur the equal risk of becoming a “gateway crime” to the legal system. With a prison record from a marijuana arrest, a person of color may have more difficulty finding employment and re-entering society – ironically pushing them to desperation and possibly new and greater crimes than their initial arrest.

.

.

View this pie chart in more detail.

.

Below are three maps of neighborhood “hotspots” for marijuana arrests. The income of every block is indicated on a red to green color scale from low to high income. The population of Latinos and Blacks per square mile is also indicated; unsurprisingly, these groups cluster in low-income neighborhoods. On this base map is the geo-referenced address of every arrest for marijuana possession or sale from 2013 to 2017.
Marijuana arrests tend to happen in low-income neighborhoods. For instance, Manhattan’s 96th Street represents an income divide between the wealthy Upper East Side and the comparatively poorer Harlem. Drawing a “thin blue line” down 96th Street, we also identify an unspoken policing boundary. Marijuana arrests are significantly less likely to happen in the majority-White neighborhood south of 96th than in the majority-Black neighborhood north, even though both neighborhoods are of comparable population density and likely comparable rates of marijuana use. According to the UCLA: “Despite roughly equal usage rates, Blacks are 3.73 times more likely than Whites to be arrested for marijuana.” 5 Similarly, the wealthy and majority-White neighborhood of Riverdale in the Bronx has few arrests in comparison to the poorer and majority-Black West Bronx, even though these two neighborhoods are less than mile apart.


.

.

Research Method

.

Note that on the above map, there are numerous low-income neighborhoods without any drug arrests. This is largely because these areas have little to no population, such as Central Park or LaGuardia Airport. Controlling for population density, marijuana arrests still target communities of color.
This project was assembled from public data. I downloaded anonymized microdata on the race, crime, gender, and approximate age of every individual arrested by NYPD, as well as the address where this individual was arrested. Of the approximately 1.7 million arrests in this data set, I filtered out the marijuana crimes. The colored basemap indicating per capita income and race by city block is extracted from Tableau Public, the mapping software I use. The infographics presented above can be explored or downloaded here. Arrest data is from NYC Open Data here.

.

Endnotes

  1. Marijuana arrests represent 5.98% of all NYPD arrests in 2017.
  2. From “Statista,” accessed 15 January 2019, link.
  3. From the United States Census Bureau, 2010 statistics on NYC demographics, link to report, link to database.
  4. From the Drug Policy Alliance, accessed 15 January 2019, link to press release, link to report.
  5. From the American Civil Liberties Union, accessed 18 January 2019, link to article.

New York City Subway Ridership

Created with data from the MTA.
Published by Gothamist on 22 January 2019.
Related: my data visualization of London Underground commuting patterns.

.

The visual language of data addresses a deeper need to humanize and soften the concrete jungle.

.

Sounds of breathingheartbeat, and subway from Freesound

.

In this animation based on subway ridership statistics by station:
● Dots are color-coded according to the subway lines they serve.
● White dots are for junctions between two or more lines of different color.
● Dot size corresponds to the number of riders entering each station within a 24 hour period.
● Larger dots are for busier stations. Smaller dots are for less busy stations.
Movements through the New York City subway are analogous to rhythmic breathing.
People often describe cities in relation to the human body. Major roads are called “arteries” in reference to blood flow. The sewers are the city’s “bowels” in reference to our own digestive systems. Central Park is the city’s “lungs.” At various times in history, key industries like garments and finance were described as the “backbone” of New York’s economy. Although cities are complex organisms, wordplay makes the giant metropolis somehow more human and familiar.
The 424 subway stations and 665 miles of track are analogous to the human circulatory system. Every weekday pre-coronavirus, the subway carried 5.4 million people, mostly commuters. This daily commute is ordered, structured, and rhythmic – as Manhattan’s population swells during the daily commute and then contracts by night. Each passenger symbolizes the movement of a single red blood cell. With each paycheck, the oxygen of capitalism flows from the heart of Manhattan to the cellular homes in the outer boroughs.
Commuting patterns mirror the rhythmic expansion and contraction of the human body while breathing. By contrasting weekday and weekend ridership patterns, we detect the city’s respiratory system.

.

.

Interactive Map

.

Research Method

In this video lecture, I walk you through how I manipulated MTA and NYC open data
to create this animation.

.

The Metropolitan Transit Authority (MTA) publishes statistics on weekday and weekend (Saturday + Sunday) ridership for all 424 stations. These statistics, updated yearly, are public and can be analyzed to track trends in urban growth. I downloaded the MTA data and assigned each station a geographical coordinate (latitude + longitude) so that the data points would appear at their corresponding map locations.

I have a love-hate relationship with the New York City subway. At rush hour, it is crowded, hot, and slow. From years of riding its squeaky trains, it’s given me a ringing tinnitus sound in my ear. Despite its flaws, the subway is one of the few urban spaces where all social classes and ethnicities mix, where their separate lives are momentarily shared. Rich or poor, everyone rides the subway. I hope this animation renews appreciation for this engineering and the people behind it.

.

Sources