Contradictions of Solitary Confinement
at Eastern State Penitentiary
Master’s thesis at the University of Cambridge: Department of Art History & Architecture
Developed with Max Sternberg, historian at Cambridge
.

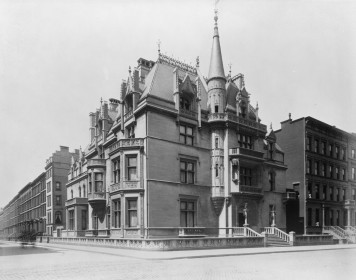
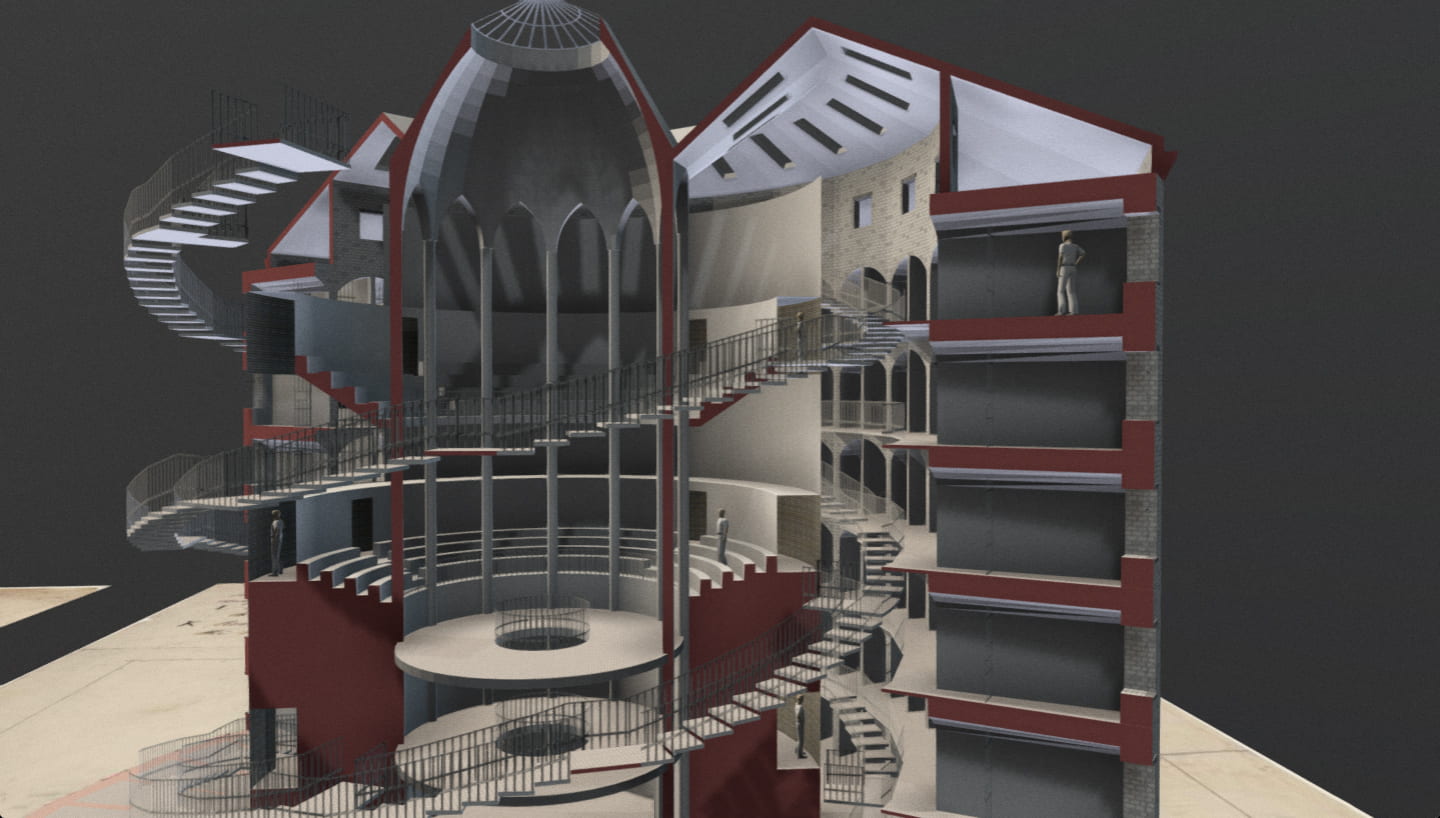
View of cellblocks and guard tower

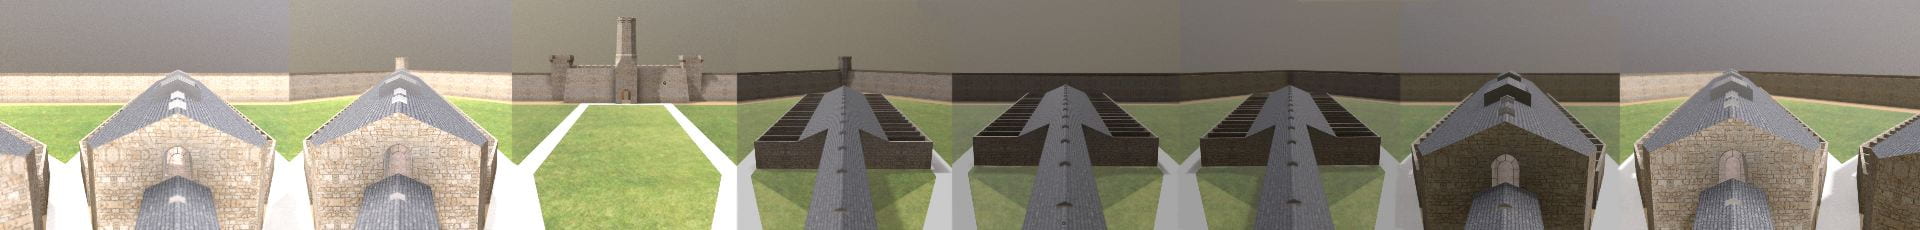
Eastern State Penitentiary guard tower
.
The perfect disciplinary apparatus would make it possible for a single gaze to see everything constantly. A central point would be both the source of light illuminating everything, and a locus of convergence for everything that must be known: a perfect eye that nothing would escape and a centre towards which all gazes would be turned.
– Michel Foucault
.
Abstract
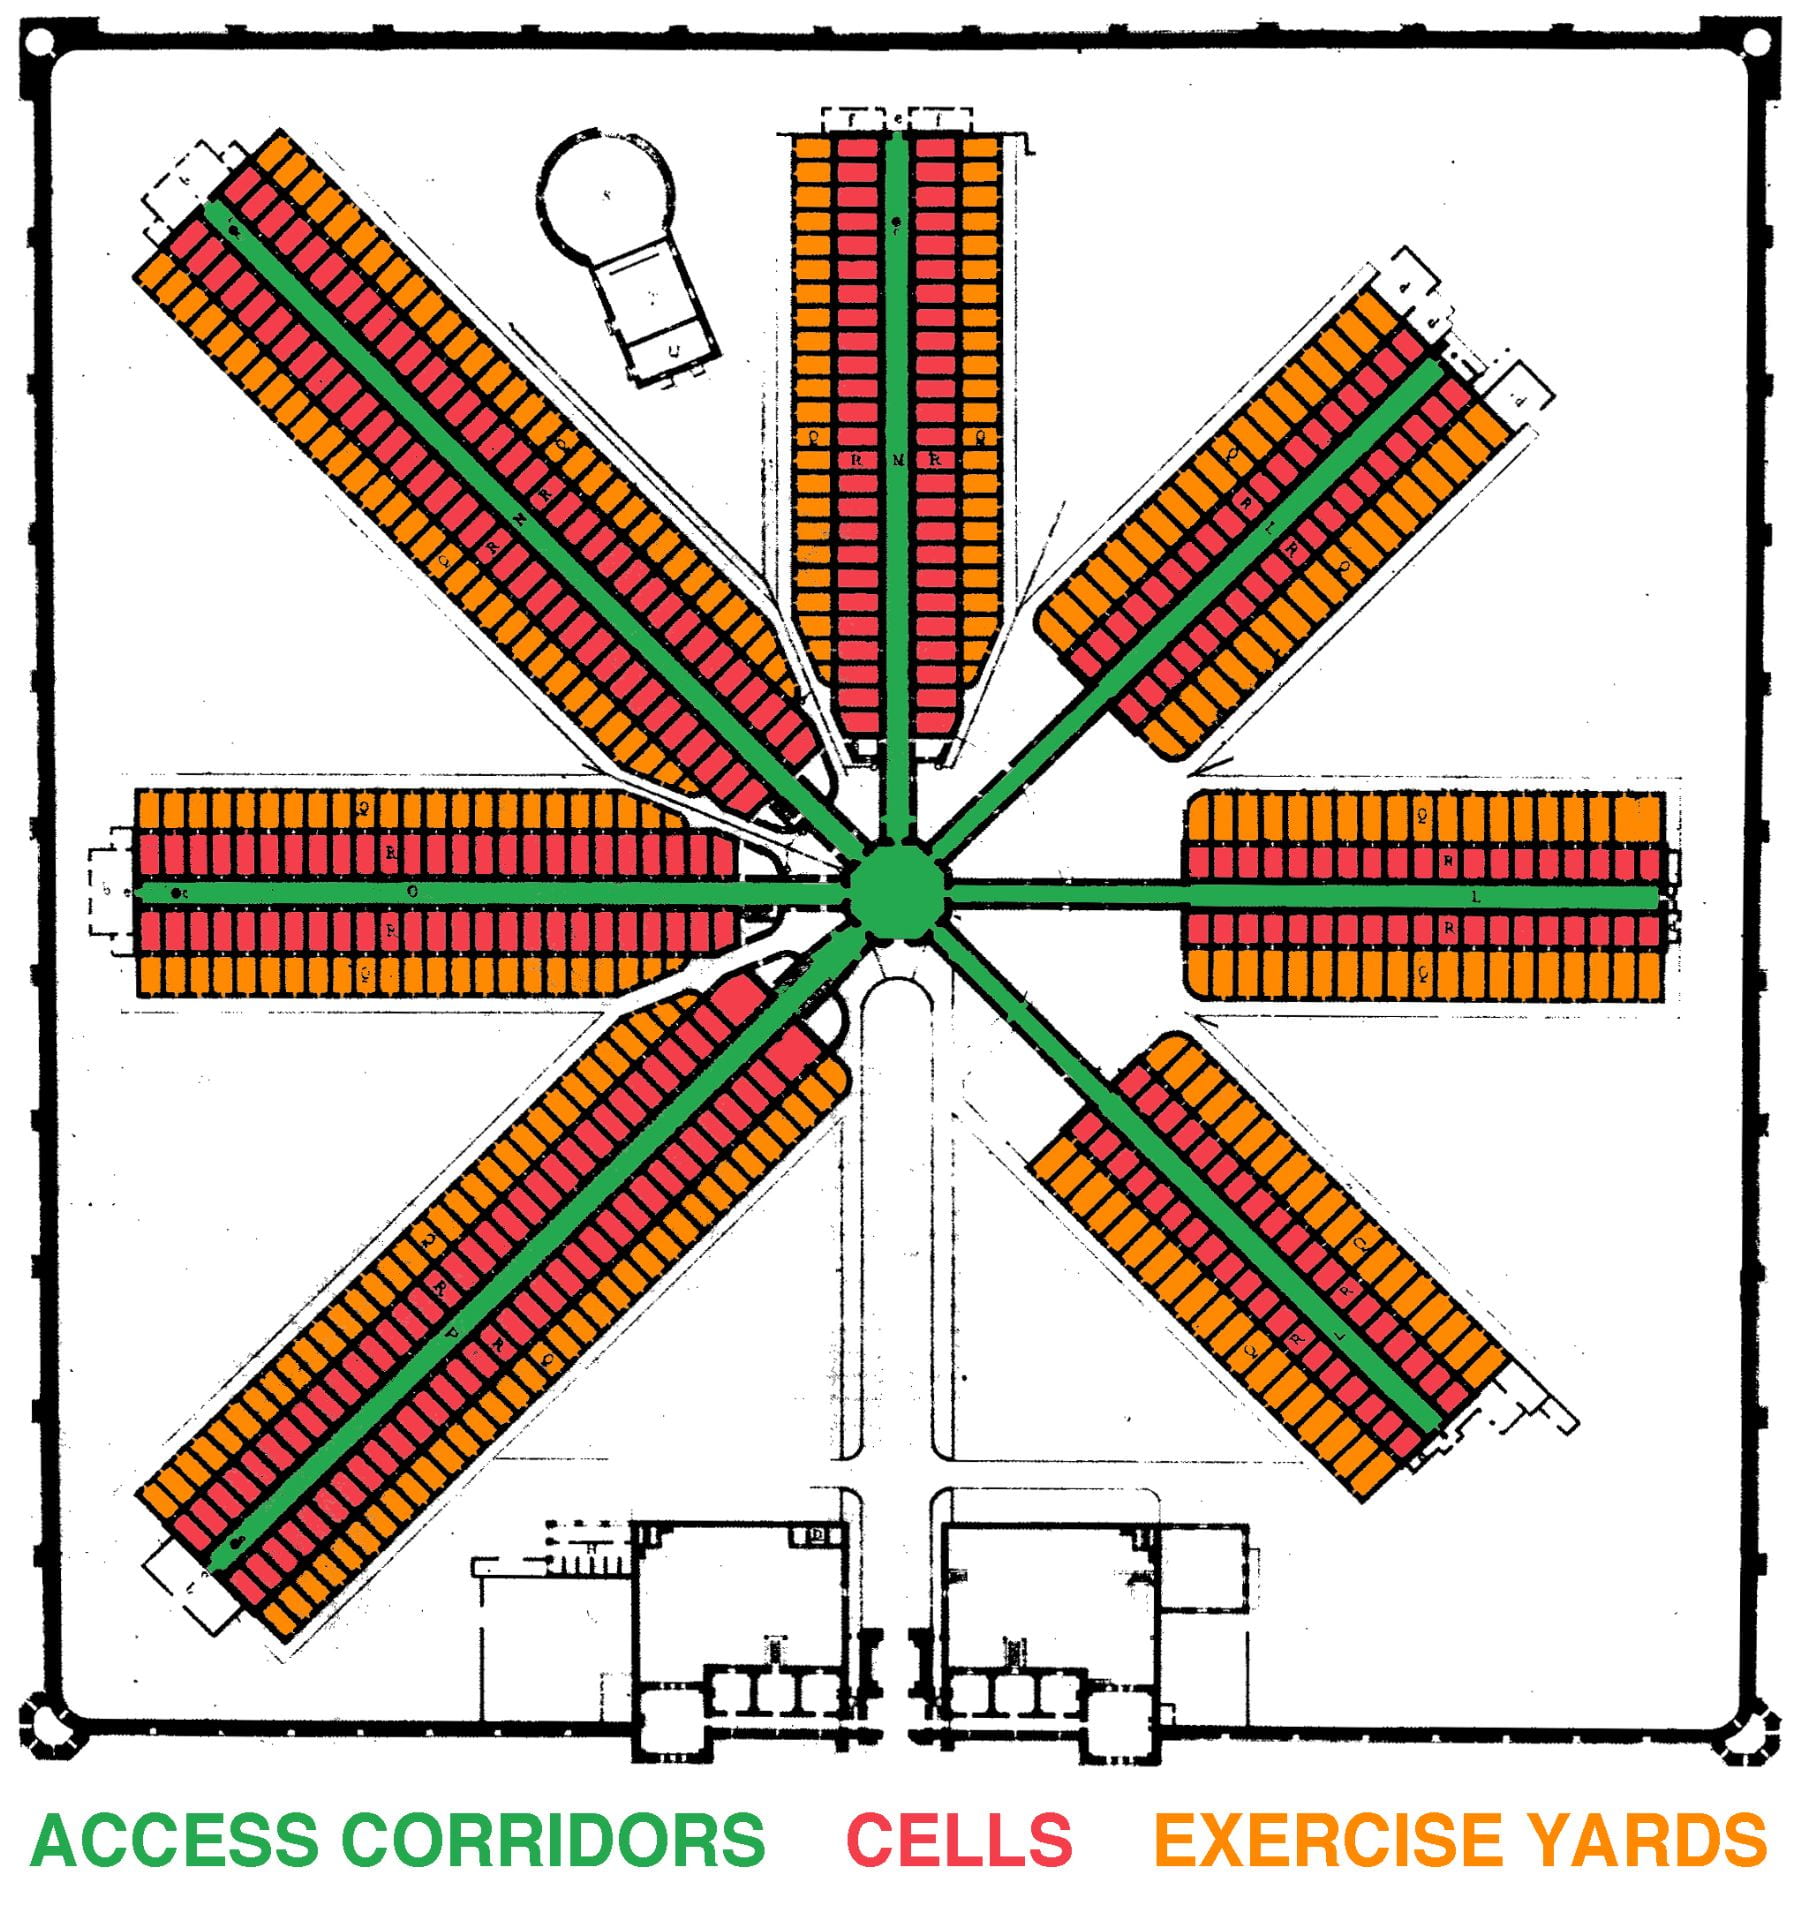
Prison floor plan in 1836
In the contemporary imagination of prison, solitary confinement evokes images of neglect, torture, and loneliness, likely to culminate in insanity. However, the practice originated in the late-eighteenth- and early-nineteenth-century as an enlightened approach and architectural mechanism for extracting feelings of redemption from convicts.
This research examines the design of Eastern State Penitentiary, built by English-born architect John Haviland from 1821 to 1829 in Philadelphia, Pennsylvania. This case study explores the builders’ challenge of finding an architectural form suitable to the operations and moral ambitions of solitary confinement. Inspired by Jeremy Bentham’s panopticon, Haviland’s design inspired the design of over 300 prisons worldwide. With reference to primary sources and to philosophers Jeremy Bentham and Michel Foucault, this research interrogates the problematic assumptions about architecture and human nature encoded in the form of solitary confinement practiced at Eastern State Penitentiary, which has wider implications for the study of surveillance architecture.
.
 Click here to read
.
Acknowledgments
I am indebted to Max Sternberg for his attentive guidance throughout this research, and his support of my experience in providing undergraduate supervisions at Cambridge. I am grateful to Nick Simcik Arese for encouraging me to examine architecture as the product of labor relations and relationships between form and function. I am inspired by Alan Short’s lectures on architecture that criticize the beliefs in health and miasma theory. My research also benefits from co-course director Ronita Bardhan. Finally, this research is only possible through the superb digitized sources created by the staff of Philadelphia’s various archives and libraries.
I am particularly indebted to the guidance and friendship of Andrew E. Clark throughout my life.
The COVID-19 pandemic put me in a “solitary confinement state-of-mind,” allowing me to research prison architecture from a comfortable confinement of my own.
.
Related Projects
.
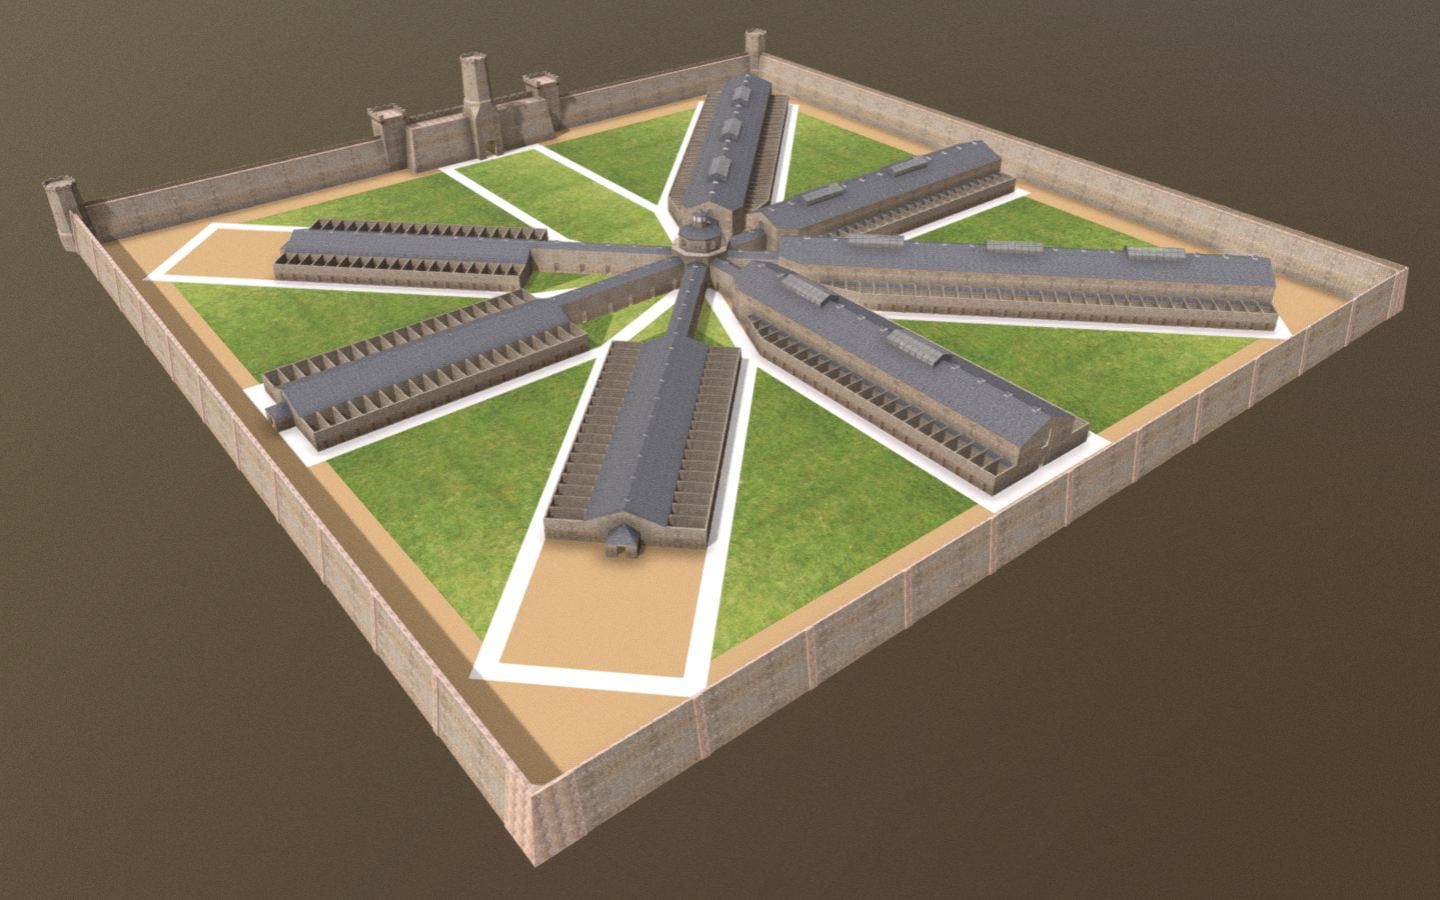
Digital Reconstruction
|
Digital Reconstruction
|
Exhibit on Prison Design
|
.
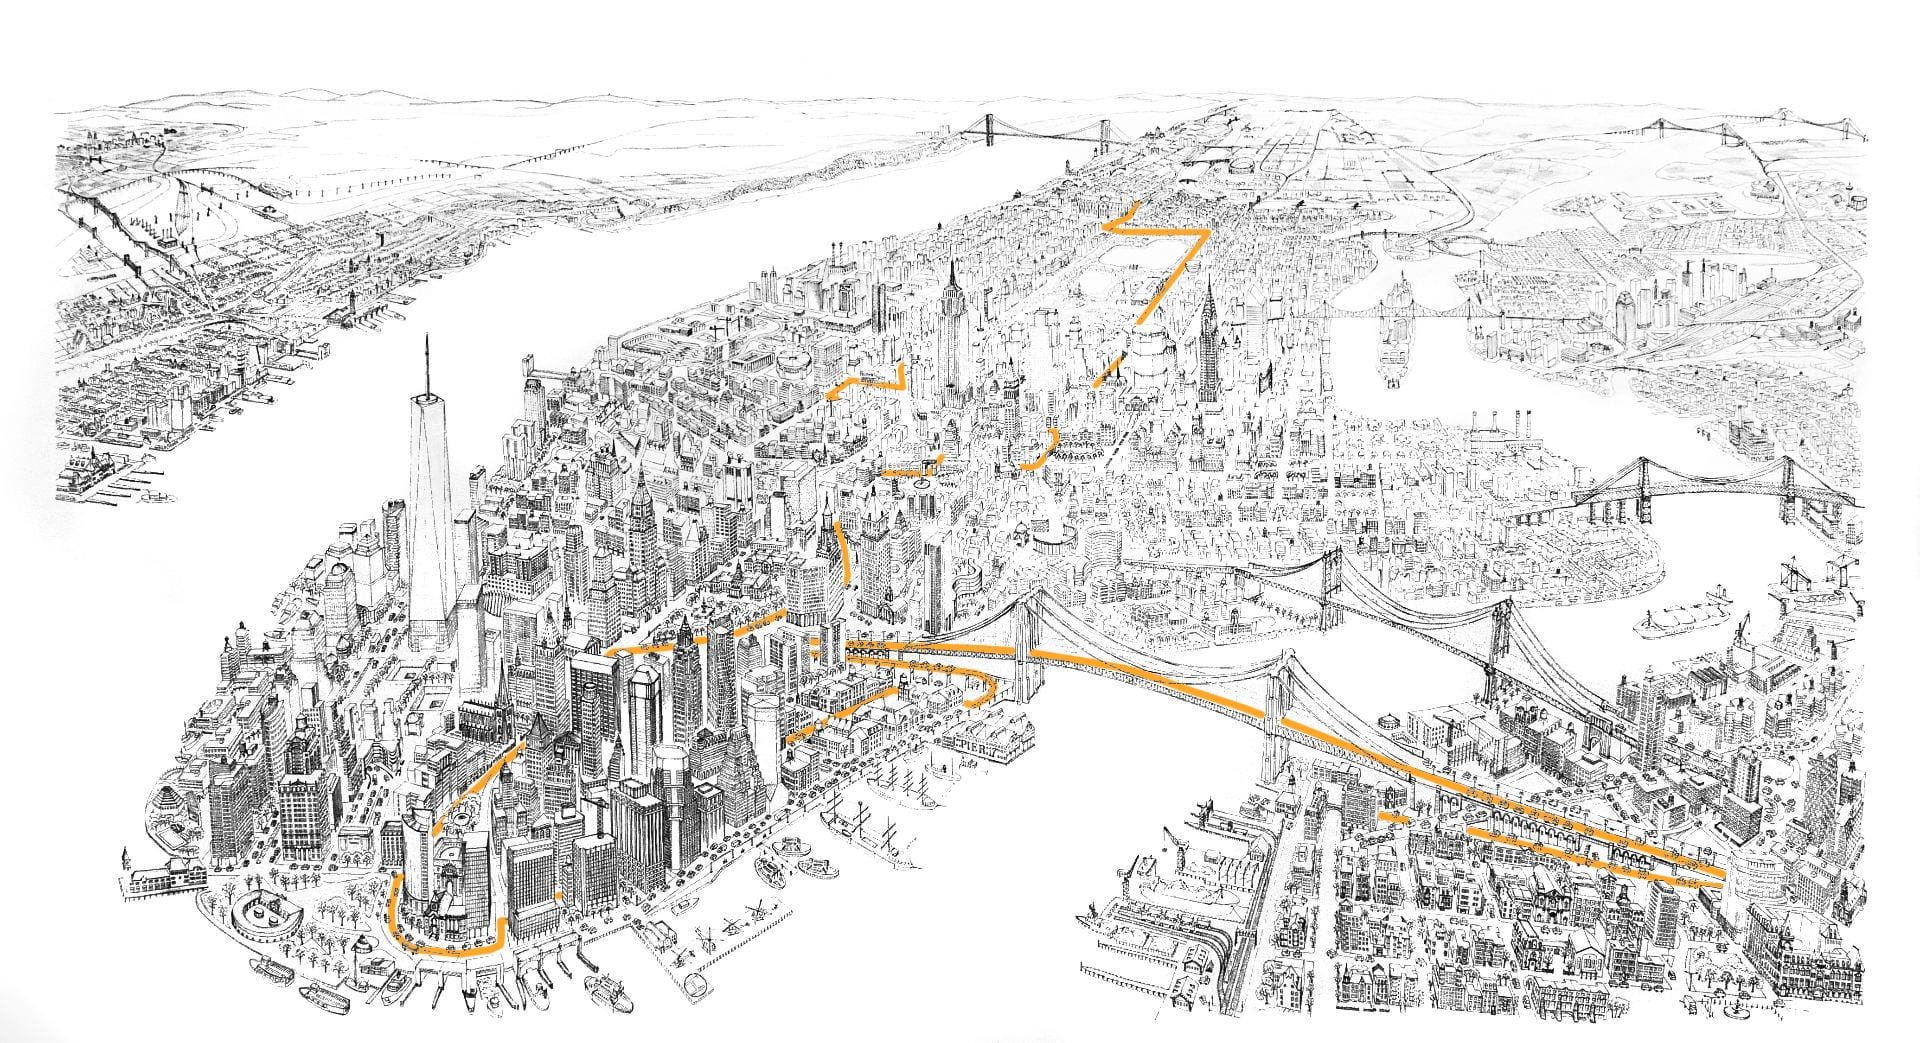


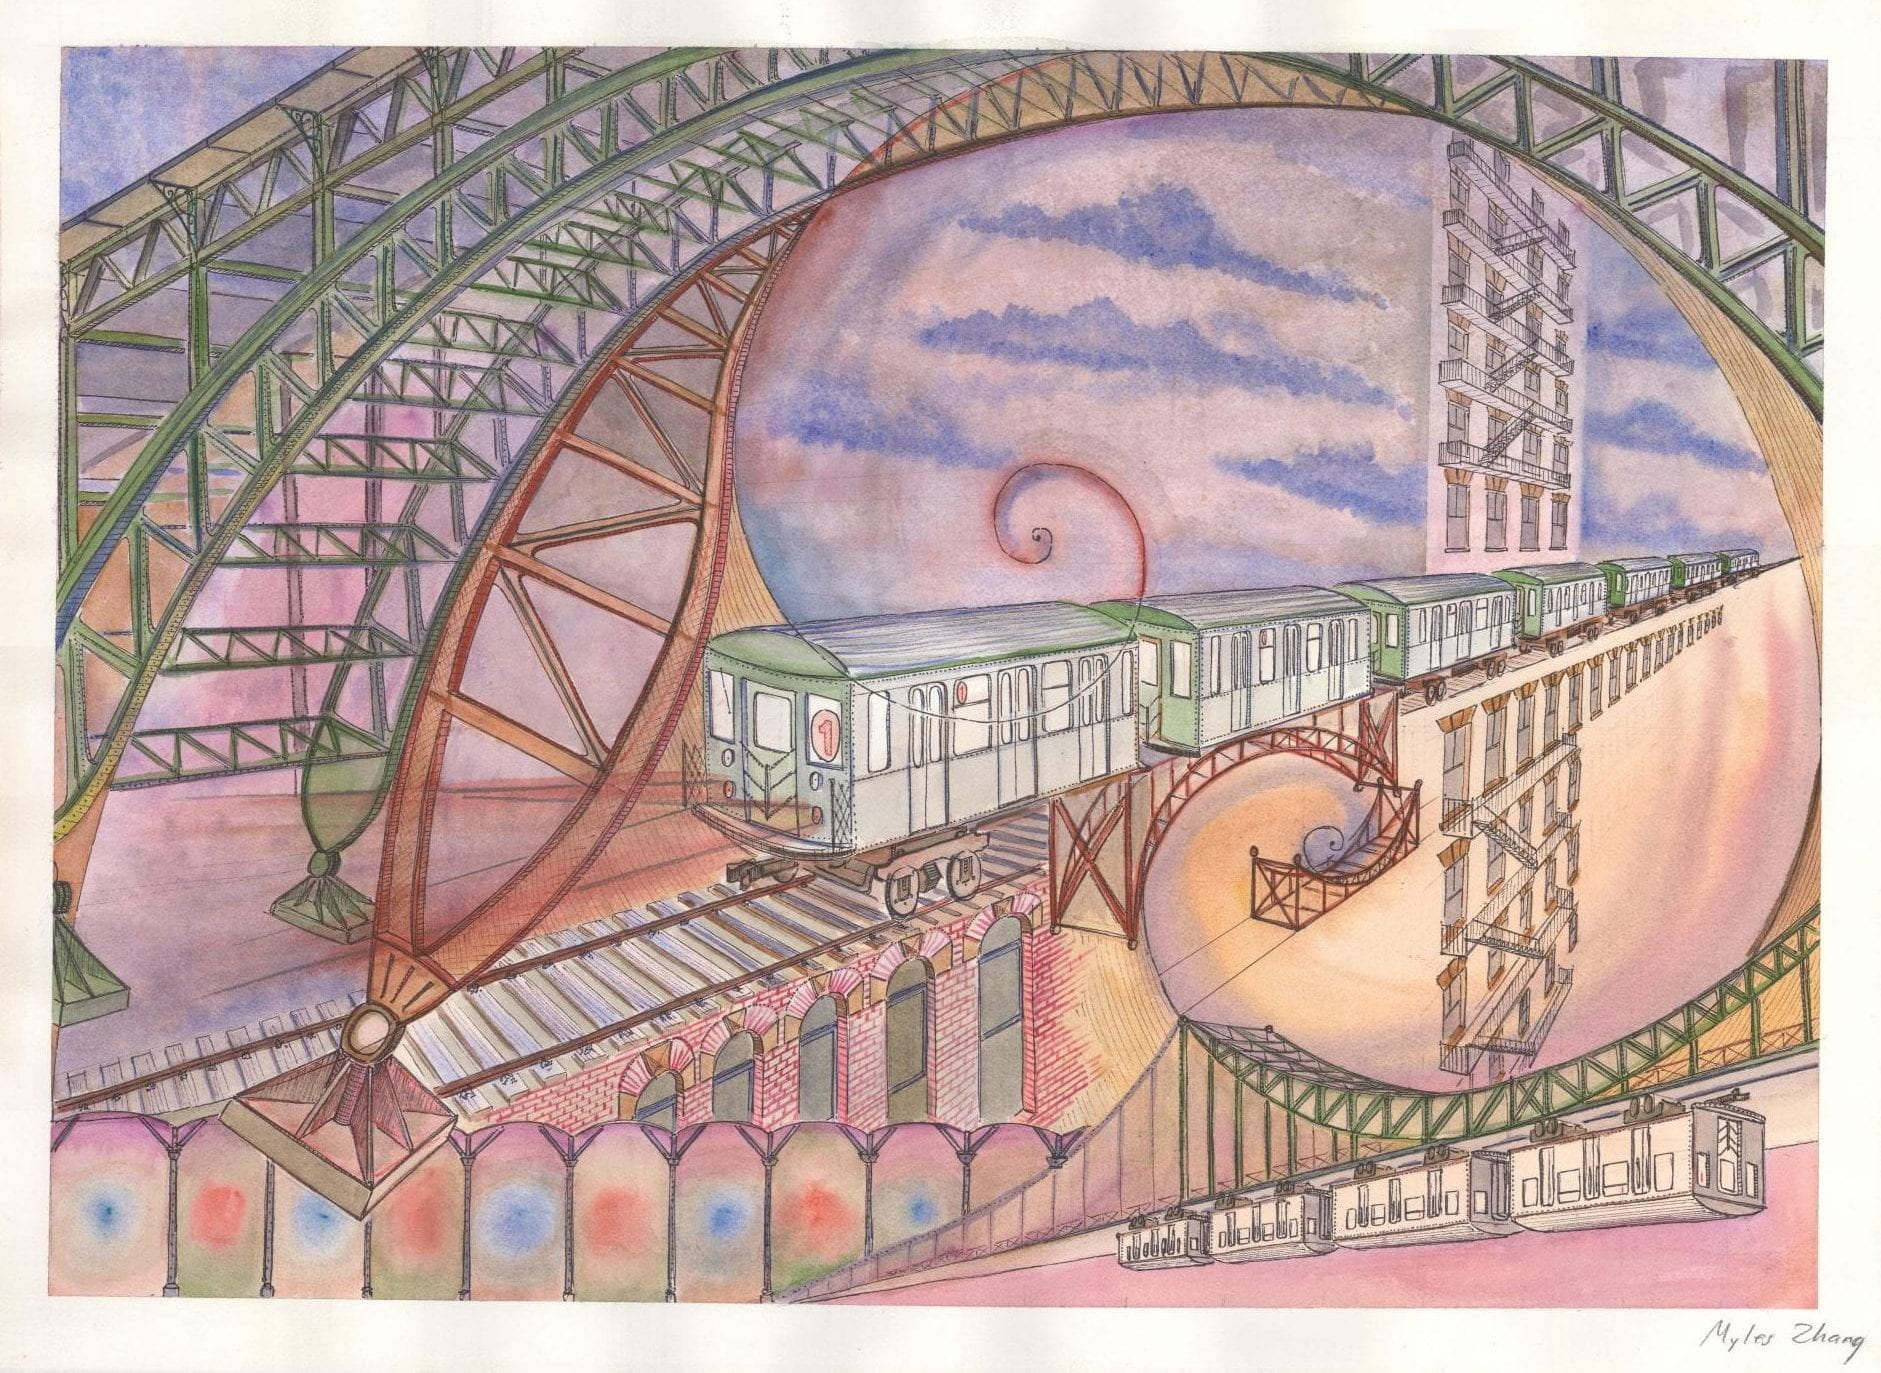
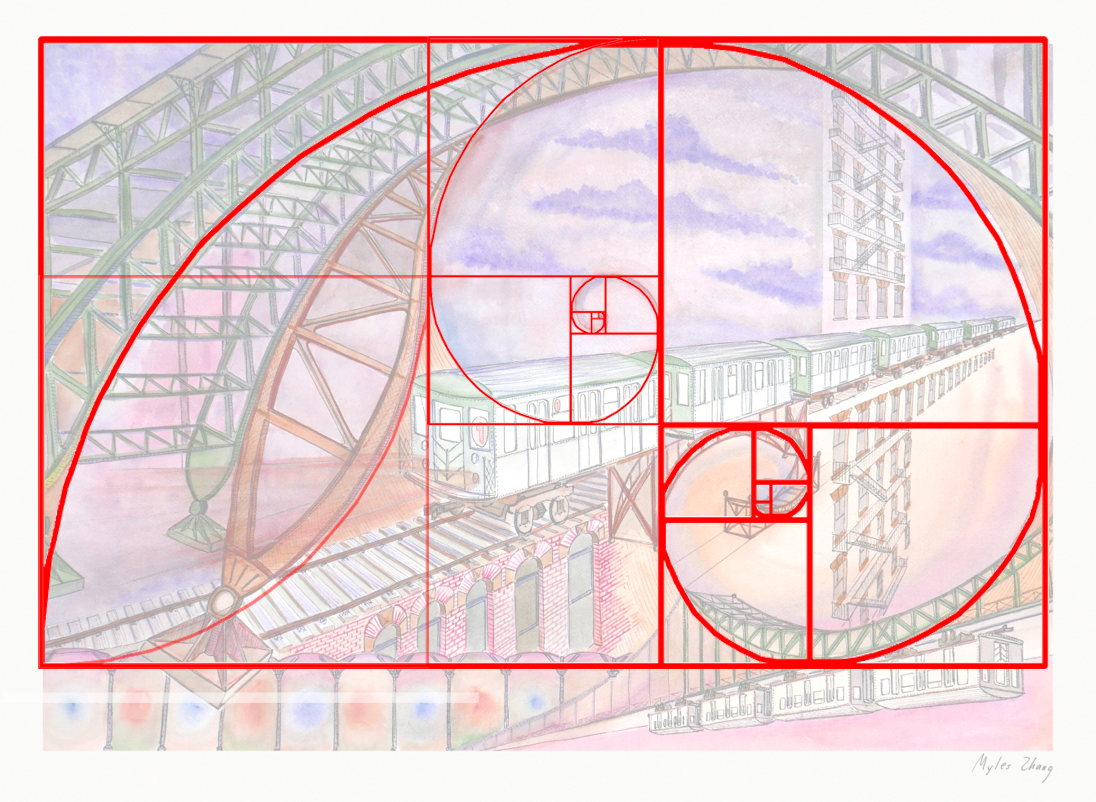 As northbound Broadway dips down to the valley of 125th Street, the subway soars over the street. The subway viaduct is a jumble of steel slicing through the orthogonal city grid. The 125th Street viaduct is a massive arch, 250 feet from end to end, two hundred tons of mass channeled into four concrete pylons, resting on the solid bedrock of Manhattan schist. The subway is the intersection, where the underground and aboveground worlds of New York City converge.