• This website includes dozens of videos, hundreds of essays, and thousands of drawings created over the past twenty years. Search to learn more about the history of buildings, places, prisons, Newark, New York City, and my PhD research on spatial inequality.

  • Or scroll down for the latest publications.

Goodbye Baxter Terrace

Written by my father Zemin Zhang on December 2, 2007


“I love you darling’
“Baby, you know I do
“But I’ve got to see this Book of Love
“Find out why it’s true”
Every day in 1955, Charles Patrick, 17, and a group of teenagers came together to sing in the Baxter Terrace’s recreation hall.  By 1958, they had sung their heart out and their song, “Who Wrote the Book of Love?” hit the country and even spread as far as Europe and Australia.  “Oh, I wonder, wonder ohm ba doo who….. who wrote the book of love?”  Charles never found the answer and two members of the Monotones, the Ryanes Brothers, died in their 30’s.  Now that Baxter Terrance has been scheduled for demolition, I wonder if people could find some old and broken pages of the Book of Love from the rubble of this 66 year-old project.


Immediately after the establishment of the Newark Housing Authority (NHA) in 1938, word spread out that one of  four “low-cost “ projects, a complex of 21 apartment buildings, would be in an area surrounded by Orange, Nesbitt, James, and Boyden Streets.  Among 1,363 buildings in the vicinity, 45 percent residents were black, living in substandard condition, many even without bath tubs and toilets.  (Only 10 percent of the city population was black.)  To construct the largest public housing in the state, the Orange-Nesbitt project needed to clear a few hundred buildings, while the other three (Pennington Court, Seth Boyden Court, and Stephen Crane Village)  would be built on mostly vacant land.  All land negotiations with lucrative commissions were assigned to three white agents, despite of the protest of Harold Lett, the only black NHA member.

Read More

.

The Paterson Silk Strike in Historical Perspective

1913 to 2023


A century later, the mills of Paterson sitting abandoned, their machines silent

Exactly 110 years ago today – on July 28, 1913 – Paterson silk mill workers voted to end their strike. Their strike had failed. But what has changed (or not) since then frames their historical struggle in the context of ongoing labor battles. The motivations of the strikers are as relevant in 2023 as they were in 1913: the fight for a living wage, for an eight-hour day, and – ultimately – for the right to work that feels meaningful.
The silk looms of Paterson required a high level of skill to operate: to draw the thin threads into delicate patterns, to weave the silk without breaking it, to never pull the threads too tightly that embroidered patterns curled up into themselves. Machines kept the rooms humid all year round – hot in summer, cold in winter – so that the silk threads remained damp, malleable, and less likely to tear from dryness. Workers suffered in the moisture; cases of asthma and lung diseases were common. Management was threatening to replace their skilled labor with machines. Whatever creativity and skill was still required to operate the looms was gradually being lost. Thousands in Paterson went on strike for five months from February to July 1913. They ultimately failed when management refused to concede to their demands and when workers in other mills refused to join in solidarity.
The machines in Paterson were powered first by water and wood, then coal, and finally electricity. The inventors of mill machines were scattered across the New York region. Factory machines needed to be close to the men who invented them and repaired them when, inevitably, these new inventions broke down. The investors in silk were on Wall Street and Lower Manhattan. The markets selling silk were department stores on Manhattan’s Ladies Mile, better known as Sixth Avenue. (Sixth Avenue was still largely residential.) A popular saying ran: 8th Street down the men are making it; 8th Street up the women are spending it.
The distance between markets and manufacturers was once measured in miles, the distance by train from Paterson to New York City or the distance by foot from the Triangle Shirtwaist Factory to Ladies Mile. This distance is now measured in thousands of miles. In the 19th century, Jacob Riis shocked the city’s elite with photos of Lower East Side tenements and factories located less than a mile from their Fifth Avenue homes. On June 7, 1913, the Paterson strikers brought the strike to the city. They boarded trains to Madison Square Garden and re-enacted their strike on stage for an audience in the thousands. Some strikers played on stage as police, others as management, and others as themselves. It was one of the the first times in American history that labor was transformed into a public pageant, into a public spectacle that hoped to make visible their struggle to New York City consumers. Pageants were traditionally military and state affairs that celebrated events like battle victories, elections, and fancy dress balls in theaters. To put on as large a public spectacle to celebrate striking and strikers was something new.
Fearful for their property and of socialists on their doorstep, Upper East Side residents organized their own unit of the National Guard based in a custom-built Park Avenue Avenue castle. Nicknamed the Silk Stocking Regiment for the wealth of its members, they paraded annually down Fifth Avenue in a display of wealth and force.

Read More

.

Time-lapse Animation of Triangle Shirtwaist Factory Fire

This animation reconstructs the exact conditions of the workplace, the locations of each fallen body, and the progress of the 1911 fire minute by minute. It is in an accurate-to-the-inch virtual reality model based on trial records, police reports, original measured plans, and primary sources.

.

Audio testimonies from:
Pauline Newman letter from May 1951, 6036/008, International Ladies’ Garment Workers’ Union Archives. Cornell University, Kheel Center for Labor-Management Documentation and Archives.
Louis Waldman eyewitness in Labor Lawyer, New York: E.P. Dutton, 1944, pp. 32-33.
Anna Gullo in the case of The People of the State of New York v. Isaac Harris and Max Blanck, December 11, 1911, pp. 362.

.

The Triangle Shirtwaist Factory fire on Saturday, March 25, 1911 was the deadliest fire in New York City history and one of the deadliest fires in American history. The factory was located on floors eight, nine, and ten of the Asch Building, built in 1901 for various garment sweatshops in Manhattan’s West Village.
To prevent workers from taking unauthorized breaks, to reduce theft, and to block union organizers from entering the factory, the exit doors to the stairwells were locked – a common and legal practice at the time. As a result, more than half of the ninth floor workers could not escape the burning building.
As a result of the fire and lack of workplace protections, 146 garment workers – 123 women and girls and 23 men – died by fire, smoke inhalation, or jumping and falling from the 9th floor windows. Most victims were recent Italian or Jewish immigrant women and girls aged 14 to 23.
After the fire, factory owners Max Blanck and Isaac Harris were not convicted and were ruled “not guilty.” They “compensated” each victim’s family a mere $75. The fire led to news laws requiring fire sprinklers in factories, safety inspections, and improved working conditions. The fire also motivated the growing International Ladies’ Garment Workers’ Union that organized sweatshop workers to fight for a living wage, job protections, and the right to unionize.
Click on individual annotations in model to fly around the factory and follow the time sequence of the fire.

.

Virtual Reality Model

.

Primary Sources

– Cornell University’s Kheel Center for Labor-Management Documentation & Archives (website)
– The 1,500 page transcript of witness and survivor testimonies (transcript)
– Victim names and causes of death (source and map of victim home addresses)
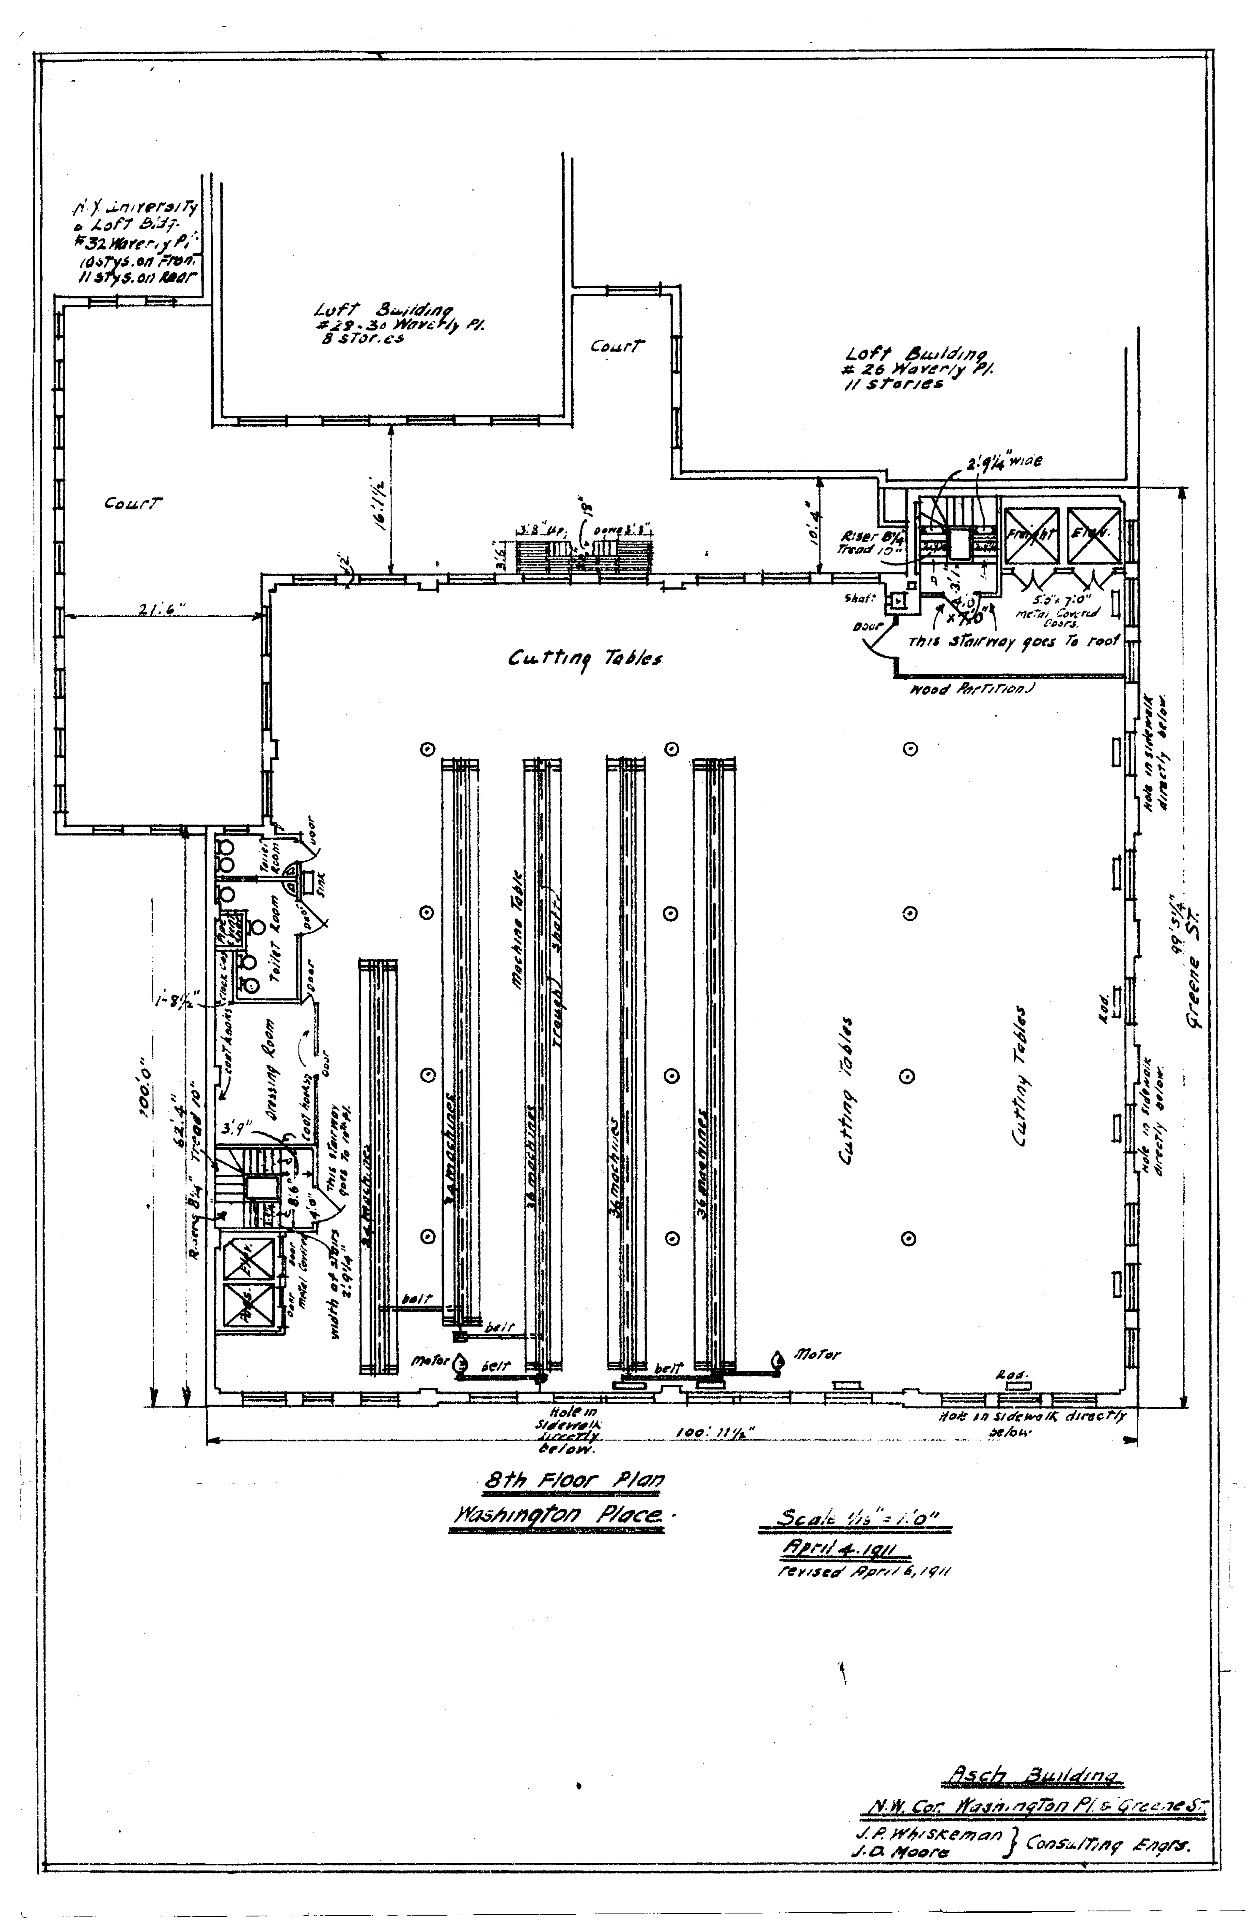
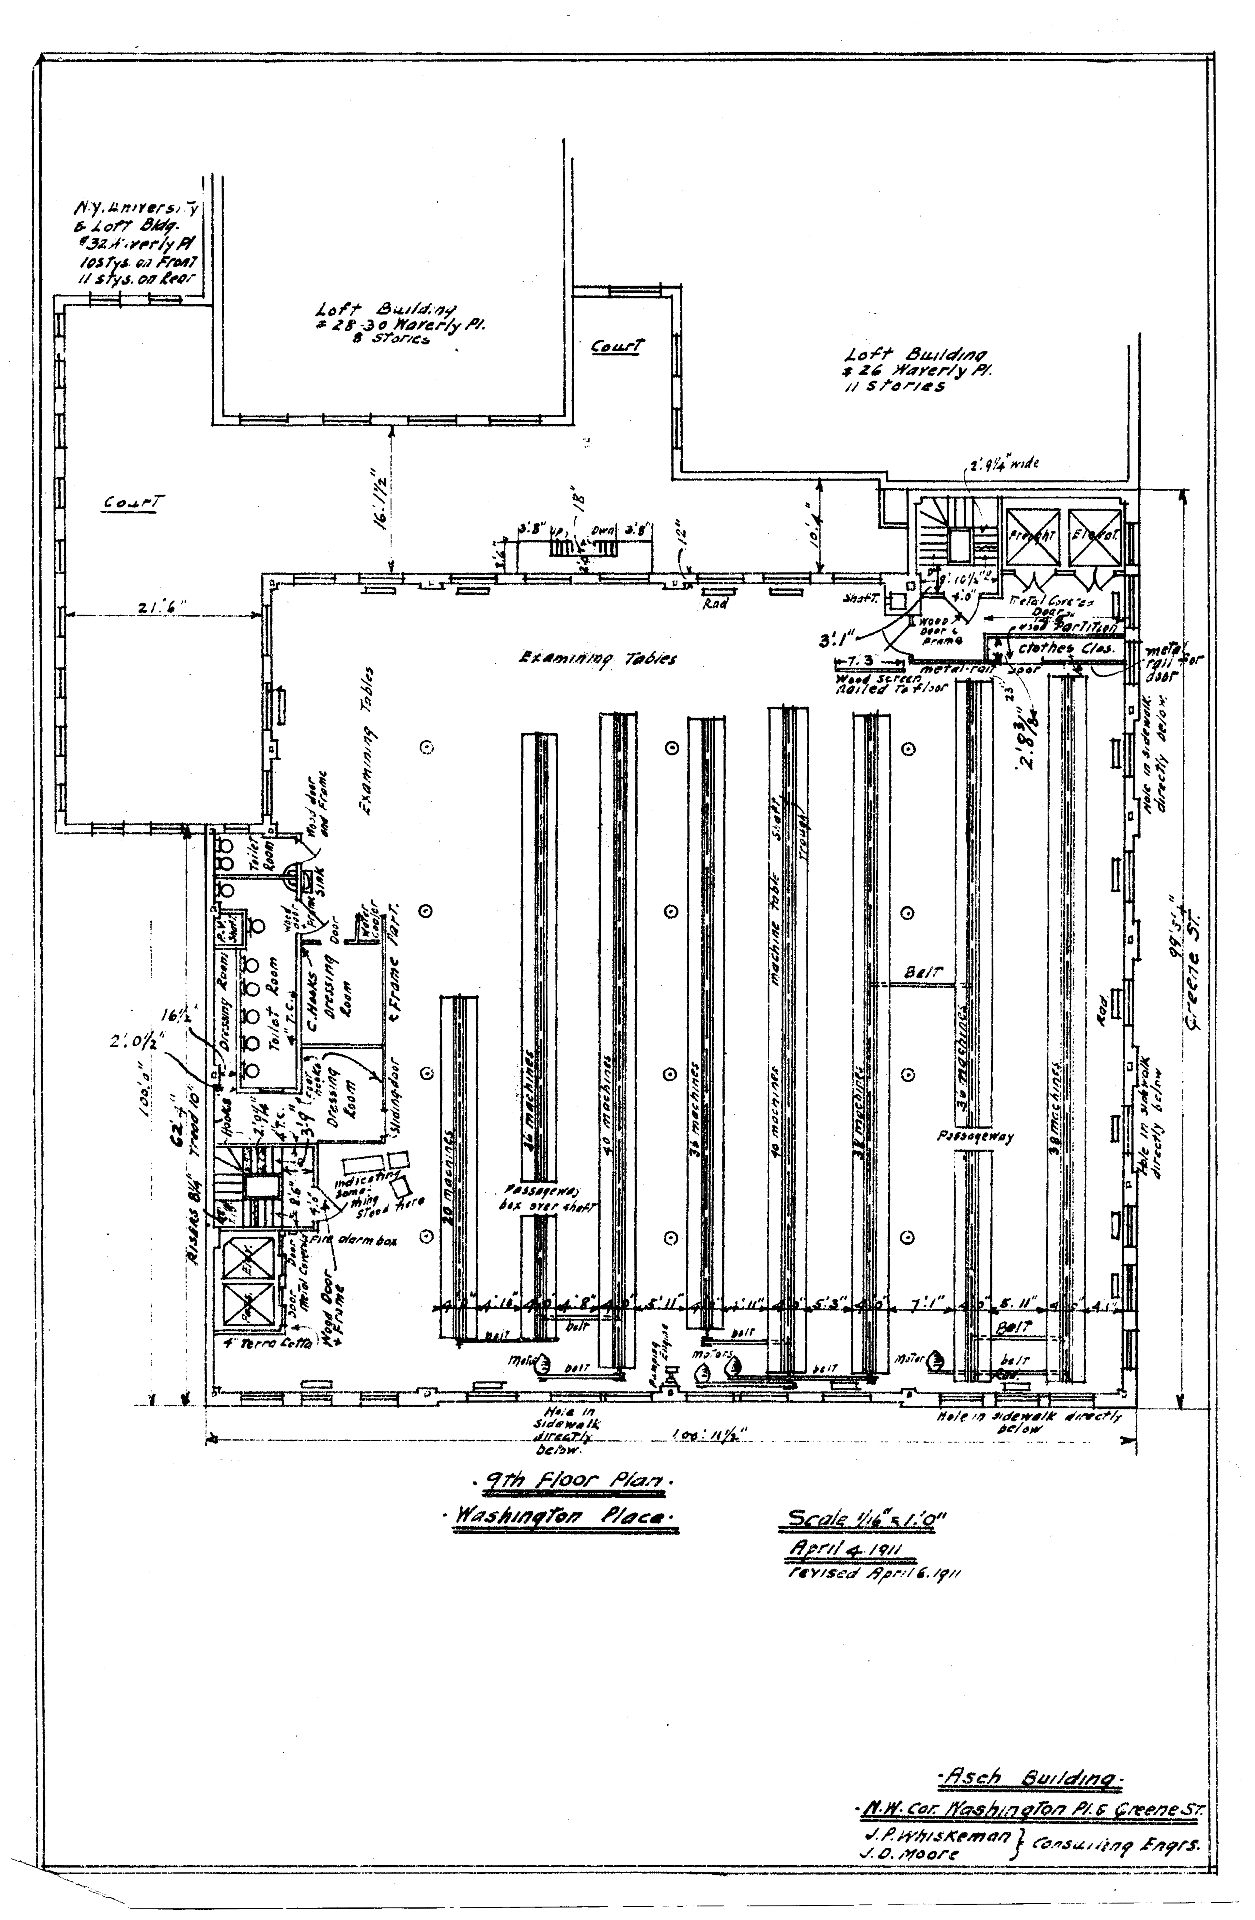
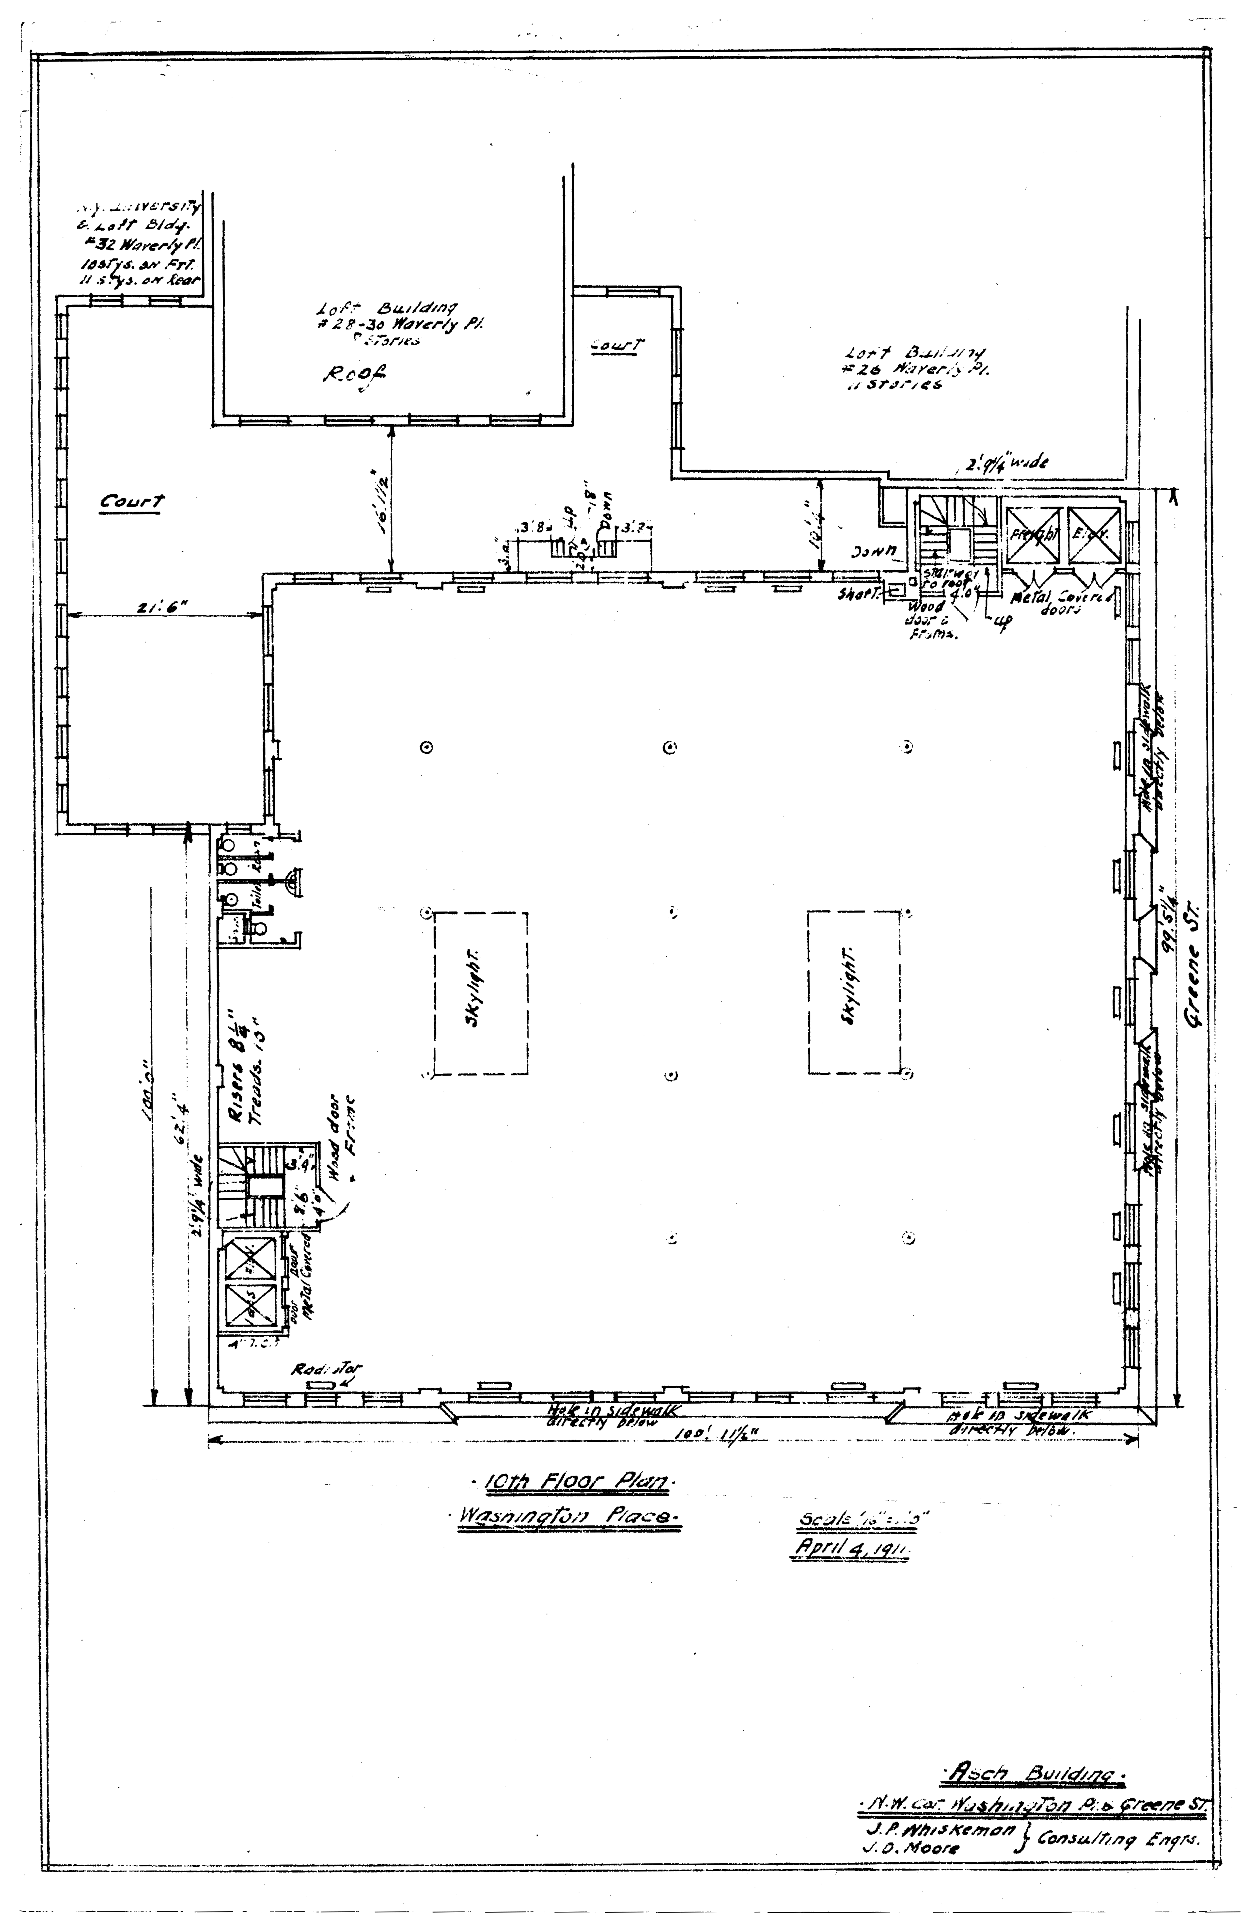
– Original architectural plans of the building used in the trial (PDF plans and source)

.

Architectural Plans

.

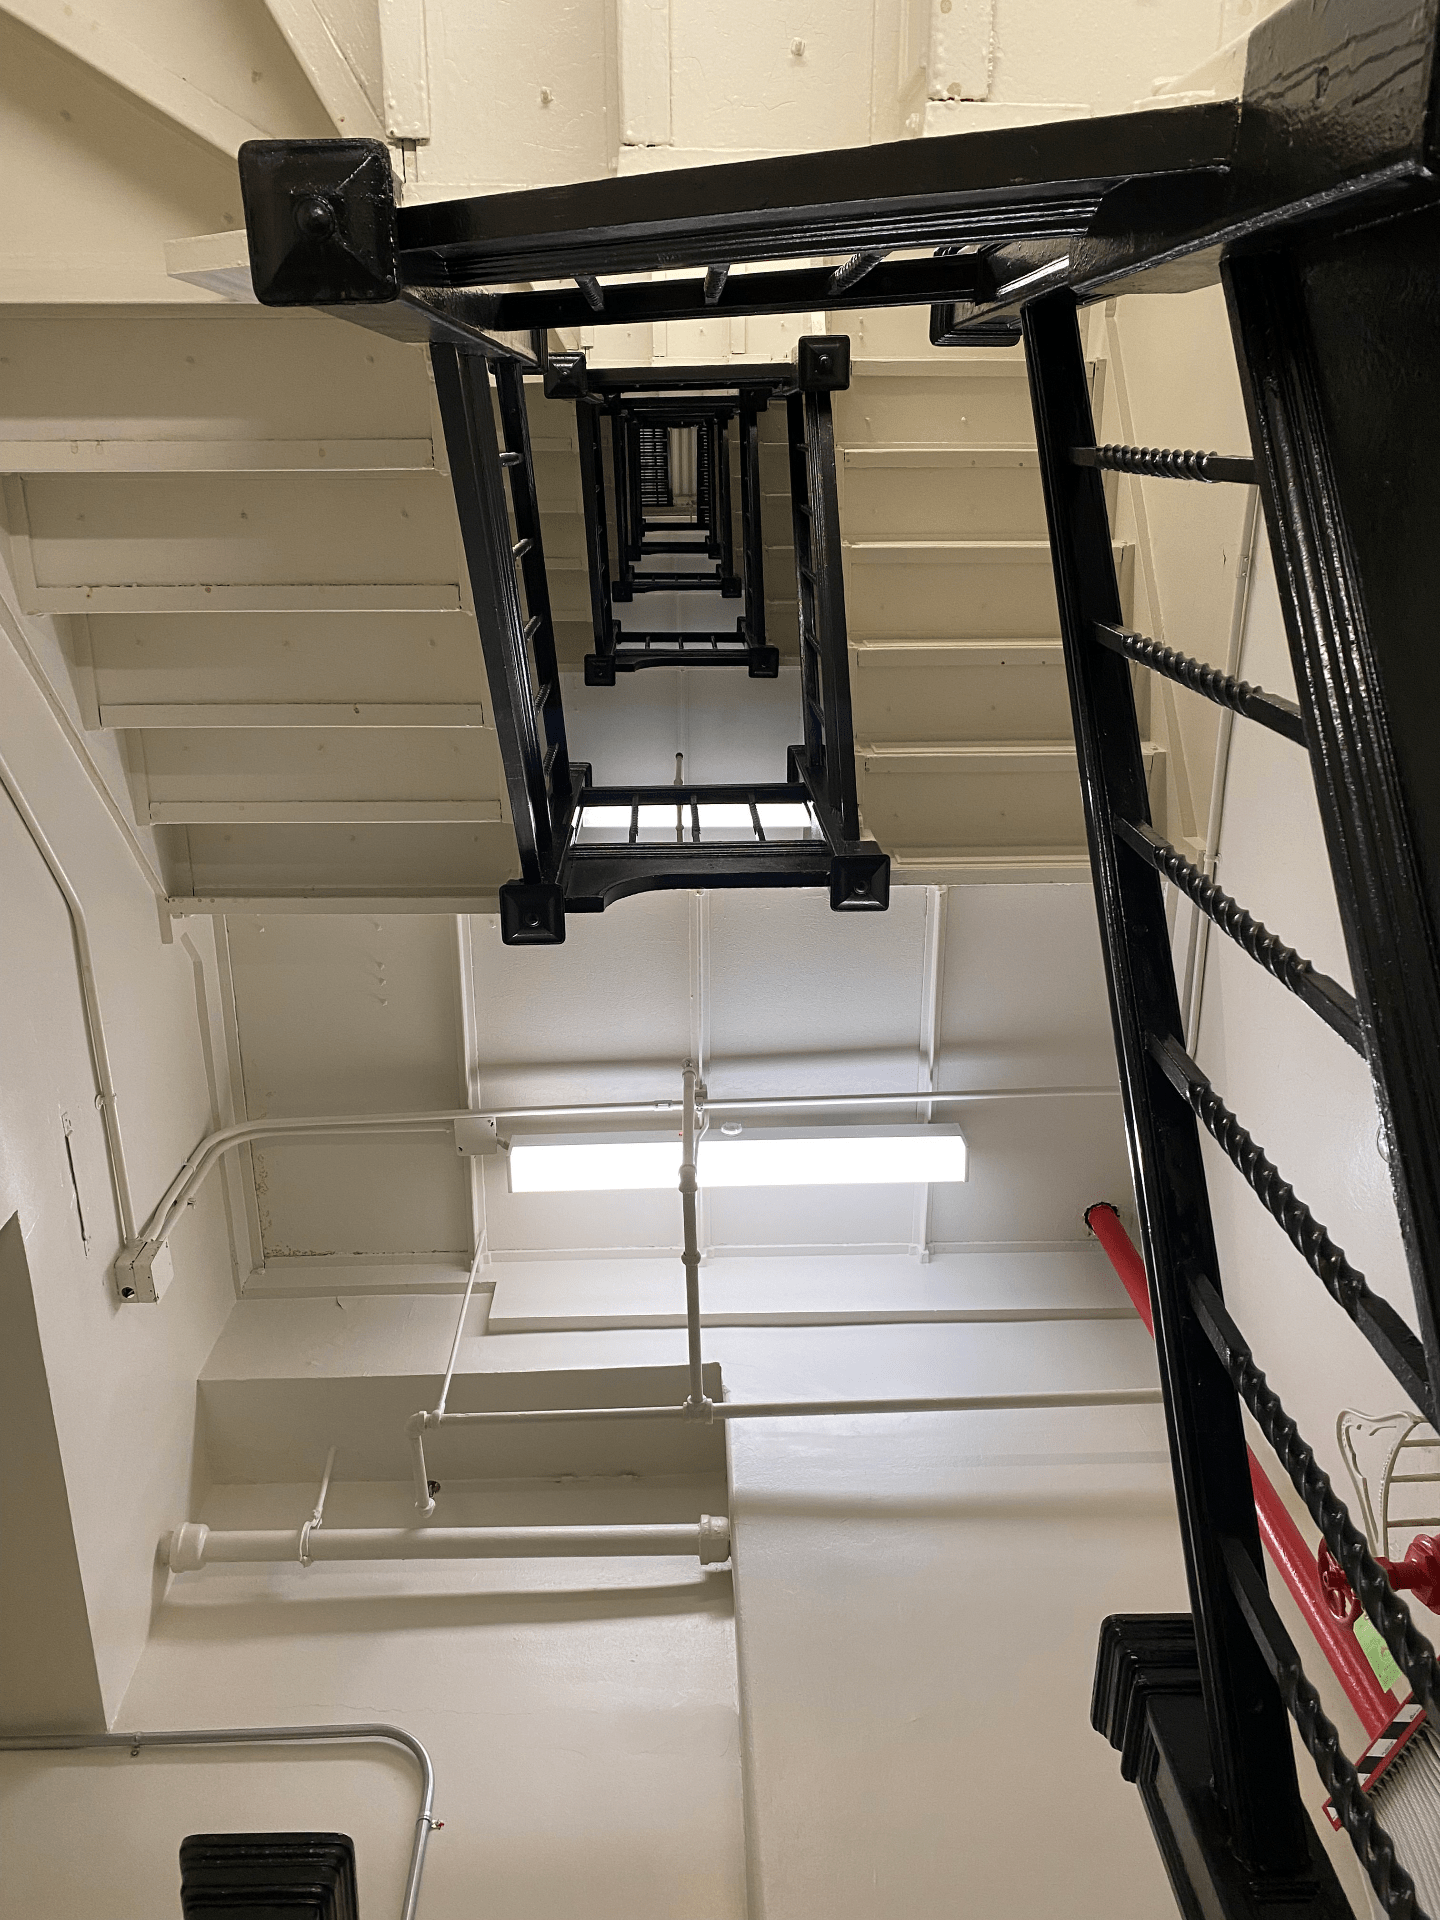
Stairway of death: view looking up the Washington Place stairway that was locked during the fire

Audio Sources

Horse drawn carriage
Power loom
Workplace bell
Classroom
Large crowd
Elevator
Small fire
Large fire
Fire truck bell
Fire hose
Dull thud
Heartbeat
– Closing song: Solidarity Forever by Pete Seeger, 1998
– Closing song: Solidarity Forever by Twin Cities Labor Chorus, 2009


Time-lapse History of the United States

This animation visualizes 272,000 data points spanning 220+ years of the U.S. census since 1790. With data from the National Historical Geographic Information System (NHGIS) at the University of Minnesota, I geo-referenced racial dot maps for all ten year intervals since 1790. Overlaying and fading time-lapse cartographies into each other reveals the scale of environmental and urban change.
● Each dot represents 10,000 people.
Top ten largest cities for each decade are labeled in orange.


Musical accompaniment by Philip Glass from the 1982 experimental film Koyaanisqatsi. In the Hopi language of the indigenous peoples of Arizona, the word koyaanisqatsi means “life out of balance.”
As you watch the map, ask:
1. How is the transformation of Indigenous lands into ranches and farmlands made visible in this film?
2. How do immigration and state policies change the built environment? In what ways are immigration and the law visible from the bird’s eye view of this film?
3. How has slavery influenced the demographic landscape and sequential racial dot maps shown in this film?
4. How do changes in transportation technology – in the sequential eras of the canal, the railroad, the highway, the airport, and now the internet – impact how people settle and distribute themselves across the built environment?

.

Sources:

1. Steven Manson, Jonathan Schroeder, David Van Riper, Tracy Kugler, and Steven Ruggles. IPUMS National Historical Geographic Information System: Version 17.0 [dataset]. Minneapolis, MN: IPUMS. 2022. http://doi.org/10.18128/D050.V17.0

2. Social Explorer. https://www.socialexplorer.com/

3. U.S. population over time

4. Top ten largest U.S. cities over time

Newark Changing: Mapping neighborhood demolition, 1950s to today


Click to launch interactive mapping experience.

.

Newark Changing is a first-of-its-kind visual encyclopedia of 2,400 photo comparisons of almost every street corner​​​, home, and building ​​demolished by urban renewal and the social forces behind urban decay.​ Through an interactive and text-searchable historic map, any visitor can travel in time to explore their street and their building as it appeared in the period 1959-68 vs. today. Thousands of old street photos are brought to life with contemporary 360-degree panoramic photos of the same street scenes today, taken from identical camera angles to the old photos. This is the most extensive collection of photo comparisons past and present ever assembled for any American city.
Newark Changing reveals the scale and devastation of urban renewal, not from the aerial perspective of the city planner’s map but from the human perspective of the street corner and neighborhood. Tens of thousands of individual streets, homes, apartments, churches, and Jewish, Black, and Italian-owned businesses in Newark were “redlined” in the 1930s and deprived of investment. Most of these neighborhoods today have been bulldozed for interstate highways, universities, hospitals, and corporate investments in real estate. Billions in taxpayer money (adjusted for today’s value with inflation) was spent in the period 1945 to 1967 to demolish at least 10,000 buildings, displacing 50,000 people, 65-77% of whom were Black. At the same time, the migration of people and jobs away from urban centers deprived cities like Newark of the industrial employment base they once had. Decades after the 1967 rebellion, Newark still struggles to confront and overcome decades of harm inflicted on the city by de-industrialization and population loss to the suburbs.
Street scenes can be browsed by interactive map, by neighborhood, by subject, by street, or by the public institution responsible for demolition. Visitors can thus travel in time to explore today’s empty fields, parking lots, and desolate streetscapes for the vibrant neighborhoods they were before the automobile age.

Launch interactive mapping experience >

The Time Columbia Built an Artificial Moon in Low Library


Low Library in 1905

.

The best definition of a university is, to my mind, a city from which the universe can be surveyed. It is the universe compressed into a city the size of Morningside Heights.
Aesthetically ancient but technologically advanced, Low Library rose to this challenge in the 1890s. Buried within hundreds of tons of Milford granite, Indiana limestone, and the unchanging architecture of antiquity were the latest technologies: electricity, steam heating, Corliss steam engines, and internal plumbing in a time when hundreds of thousands of New Yorkers still used outhouses and made less than five dollars a day. Flushing toilets – also known as crappers after Thomas Crapper who perfected their flush mechanism – were also a relatively new consumer product. It has always surprised me how the bathroom stalls at Low Library are divided by marble partitions of the highest quality that must weigh several hundred pounds each. Low Library was indeed built at a time when toilets were something to celebrate, in addition to books of course.
The goal of a great library was to collapse the universe into the size of a room. From the dome’s center was suspended a seven-foot-diameter white ball, which Scientific American described in 1898 as “Columbia’s artificial moon.” So that students could read by moonlight under a canopy of stars, this moon was illuminated against a dome painted dark to resemble the night sky. So in awe was Scientific American that they devoted as much page space to describing Low Library as to documenting the mechanics of this moon with mathematical formulas. With no other point of reference except candles, scientists calculated Columbia’s moon as equivalent in power to 3,972 candles.

.

From April 1898 issue of Scientific American

.

The only trouble was the lightbulbs’ carbon filament could only burn for 2.5 hours before “Columbia’s artificial moon” went dark. Scientists had not yet perfected the technologies of light. As a result, Columbia needed to replace the carbon filaments daily and could only illuminate the universe between the hours of 5:00 and 7:00 p.m. And yet, in line with Columbia’s Latin motto “In lumine tuo videbimis lumen” (In your light we see the light), Low Library was flanked by the emerging research departments of the global research university: physics, chemistry, mathematics, mining, engineering, and architecture. Then as now, these fields were seen as the frontiers of human knowledge.
For all the university’s focus on science, its core is built on the art and literature of antiquity. Low Library’s walls are several feet thick, thicker than was necessary in 1890s America that had moved on from heavy stone construction to steel-frame skeletal structures for skyscrapers and railroad stations. From Scientific American: “The imposing pile which forms the home of the college library looks down upon the great metropolis of the New World with something surely of the same pride with which the Parthenon of old surveyed the ancient Athenian city.” America – flush with wealth after conquering indigenous peoples in the American west – saw itself as inheriting the values of ancient Greece and Rome. New York, the American empire’s economic capital, needed cultural and intellectual symbols of power to match. Low Library was this symbol.

Read More

.

Racializing Space

Why does the American city remain so spatially and racially divided?

.

.

Why does the American city remain so spatially and racially divided decades after the 1960s civil rights movement? Practices like redlining, restrictive covenants based on race, segregated public transit, and literacy tests for voting have all been “abolished,” at least on paper and in theory. However, events since spring 2020 have returned to the public consciousness a reality that had always been obvious to millions of Americans living in poverty and in urban areas: that this country remains divided and that the racism of Jim Crow, rather than disappearing, has taken new forms.
Drawing from the perspectives of architecture, planning, sociology, and history, this conversation considers the evidence for how the American city and suburb – specifically Detroit – remain spatially divided and what steps must be taken to fulfill the dream of an egalitarian metropolis. Panelists include:
Karyn Lacy, professor of sociology and African American studies at the University of Michigan
LaDale Winling, professor of American history at Virginia Tech
Robert Fishman, professor of history at the University of Michigan’s college of architecture and urban planning

A Different Kind of Radiant City: Bucharest

Comparing Le Corbusier’s plans for Paris with Ceaușescu’s plans for Bucharest

.

.

Abstract: Comparing Le Corbusier’s unrealized plans for Paris and dictator Nicolae Ceaușescu’s completed plans for the Romanian capital Bucharest reveals similarities in their urban forms. Analysis of three features in both cities – their nineteenth-century urban forms, the integration of twentieth-century plans into the existing urban forms, and the political symbolism of each plan – reveals the two places as reflections of each other. The comparison matters because it establishes an unconscious aesthetic link between the progressive (almost utopian) urban designs of an architect like Le Corbusier and the repressive (almost dystopian) urban designs of a dictator like Ceaușescu.

.

Utopia and totalitarianism are both engaged in a mirroring game, tirelessly sending the same image back and forth as if utopia were nothing more than the premonition of totalitarianism and totalitarianism the tragic execution of the utopian dream. Only the distance that separates a dream from its realization seems to stand between the two.

– Frédéric Rouvillois
Utopia: The Search for the Ideal Society in the Western World [1]

.

Read More

.

Detroit Redlining Map in 1940

A data visualization of urban history and racializing space
Created with urban historian Robert Fishman

.

This map illustrates in three layers some of the impacts of a racist government policy called redlining:
  1. The base map shows the extent of street network development, as well as the locations of important industries, institutions, and urban features in 1940.
  2. The population dot map shows the areas where Black and Whites lived in the segregated city.
  3. The redlining map shows the areas where government and banks chose not to invest, and to therefore deprive people living there of homes.
All three features – the physical city, the urban residents, and the urban policy of redlining – are interlinked. By displaying these three features together, previously invisible aspects of urban history become visible in plain site to the public.

.

.

View project full screen

Opens in new window

.

Data sources:

Topoview from USGS for street network maps
Mapping Inequality Projecct for redlining data
IPUMS at the University of Minnesota for population and race by census tract

.

Created with help from:

Robert Fishman academic mentor
Karl Longstreth from the Clark Map Library at the University of Michigan
Gergely Baics and Wright Kennedy from Columbia History Department
whose project about racializing space in New York City inspired this proposal

“The State is Responsible”

Racial Segregation in Royal Oak Charter Township and Detroit Public Schools, a Comparative History

Written with urban historian Robert Fishman

.

Black children standing in front of half-mile concrete wall, Detroit, Michigan. This wall was built in August 1941, to separate the Black communities of Royal Oak Township / Eight Mile-Wyoming from a White housing development going up on the other side.

.

“Education, then, beyond all other devices of human origin, is the great equalizer of the conditions of men [and women] – the balance-wheel of the social machinery.”

– Horace Mann (1796-1859) promoter of free public education for all

.

If an educated public is necessary for democracy to function, then the strength of our nation’s public schools predicts the strength of our democracy. This observation would seem to be obvious and universally agreed, but in many parts of America it is not. Only seven percent of students in Detroit public schools read at or above their grade level when compared to children from neighboring suburbs. In Detroit metro, forty-seven percent of people are functionally illiterate as of 2017; the large majority are Black. These low levels of even basic literacy exist in thousands of places across the United States, not just in Detroit. In large part, this is the result of urban policies that assume that race should determine the quality of public services the state provides. An autopsy of how and why America came to be this way deserves several books and traces back several centuries. Instead, this article will analyze race-based policies that excluded Blacks from well-funded public schools in just one Detroit suburb: Royal Oak Charter Township.
First, the legal background is presented of Milliken v. Bradley, a key case before the U.S. Supreme Court in 1974 that shaped metro Detroit’s current system of school segregation. Second, the historical case study of Royal Oak Charter Township is introduced: how this township came to be and why its present existence is a continued legacy of state-sanctioned racism. Third, the history and present problems of Royal Oak Township are reflected in its failed school system. The case of Royal Oak Township is also situated in the larger context of Detroit and is linked back to Milliken v. Bradley.

.

Read Full Article

Opens as PDF in new window