As featured by Taubman College
.


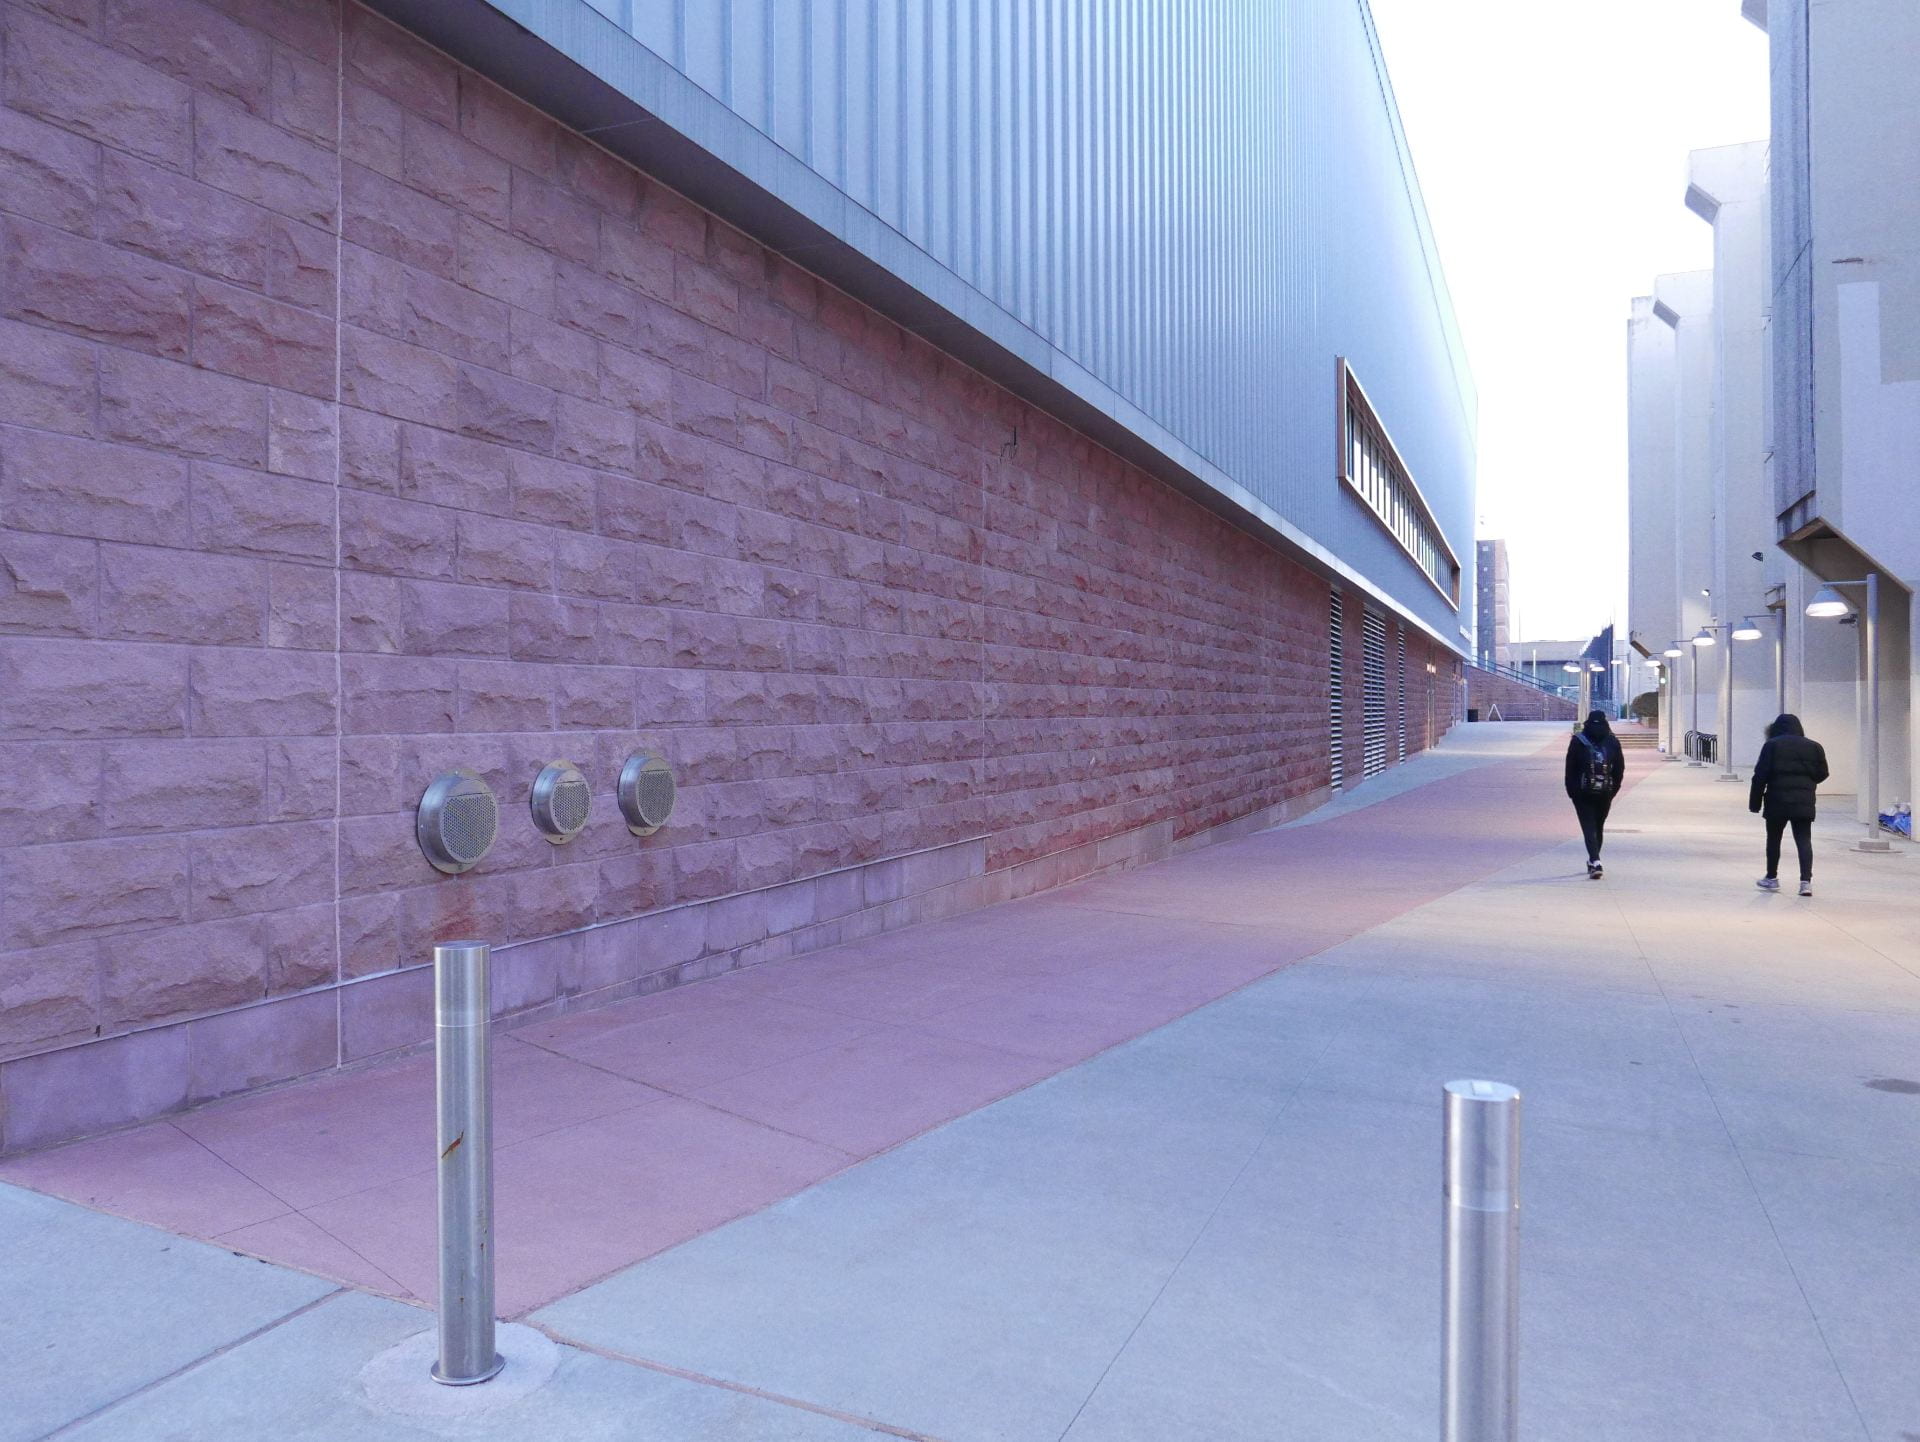
Lorch Column at Taubman College
.
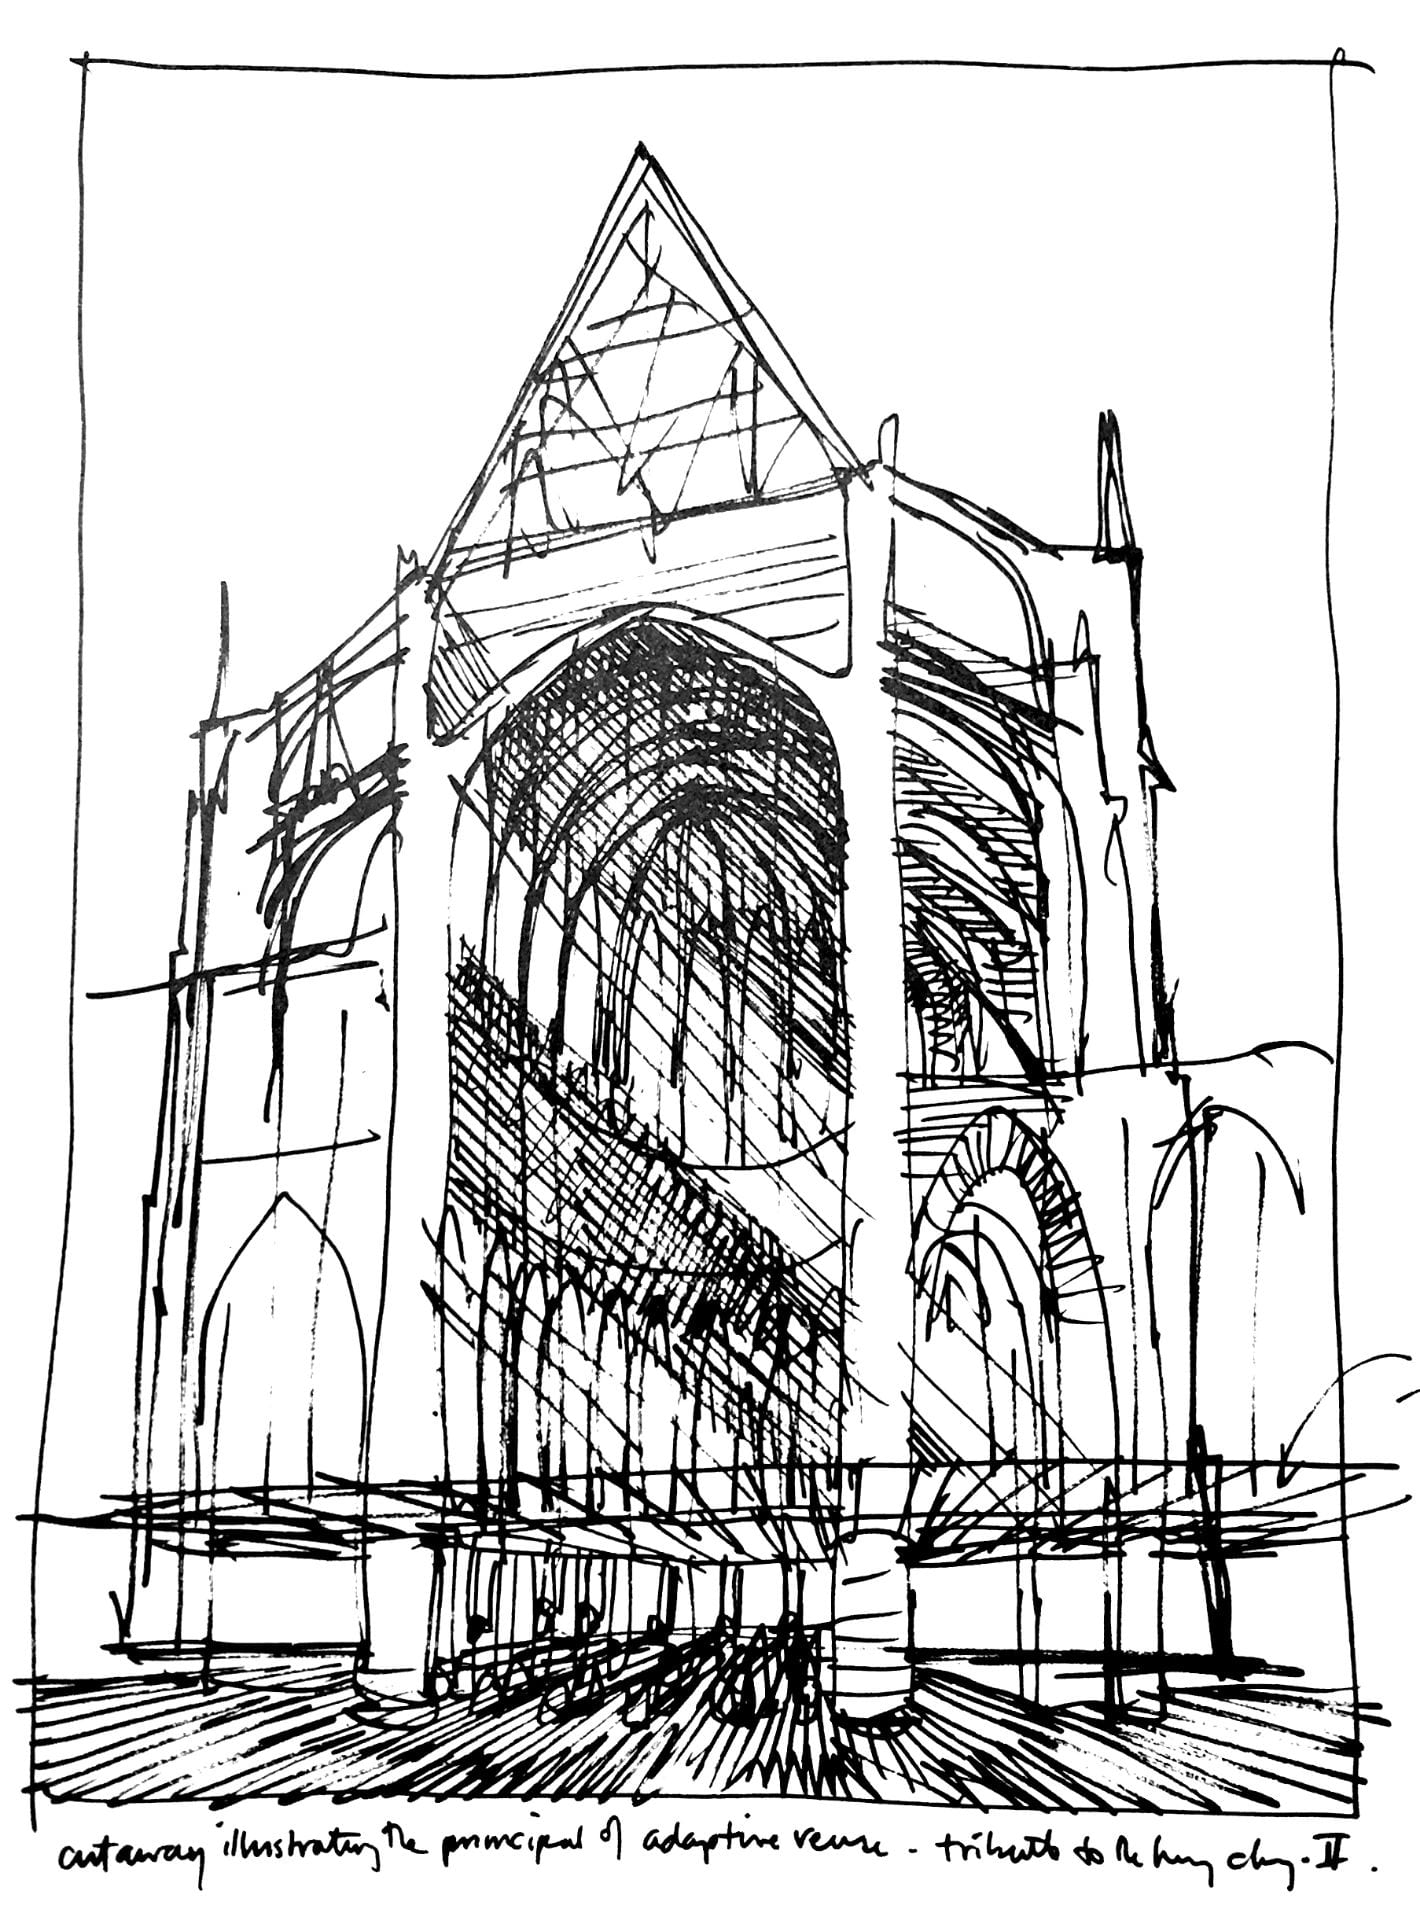
As a new Ph.D. student, the massive Lorch Column welcomed me to Taubman College. On spotting the tall column from a distance, I knew I had arrived at my new home. I later learned this column was architectural salvage from the demolished Mutual Benefit Life Insurance building in my childhood neighborhood of Newark, New Jersey. To my surprise, an important lost landmark in my own city had become an important landmark to the University of Michigan. The column’s ancient stone base and ancient stone top, linked by a modern steel skeleton, is a fitting metaphor for the synthesis of past and present, the old and the new. In another way, its unusual history of transplantation and loss is a fitting metaphor for architecture’s own fraught relationship with capitalism.
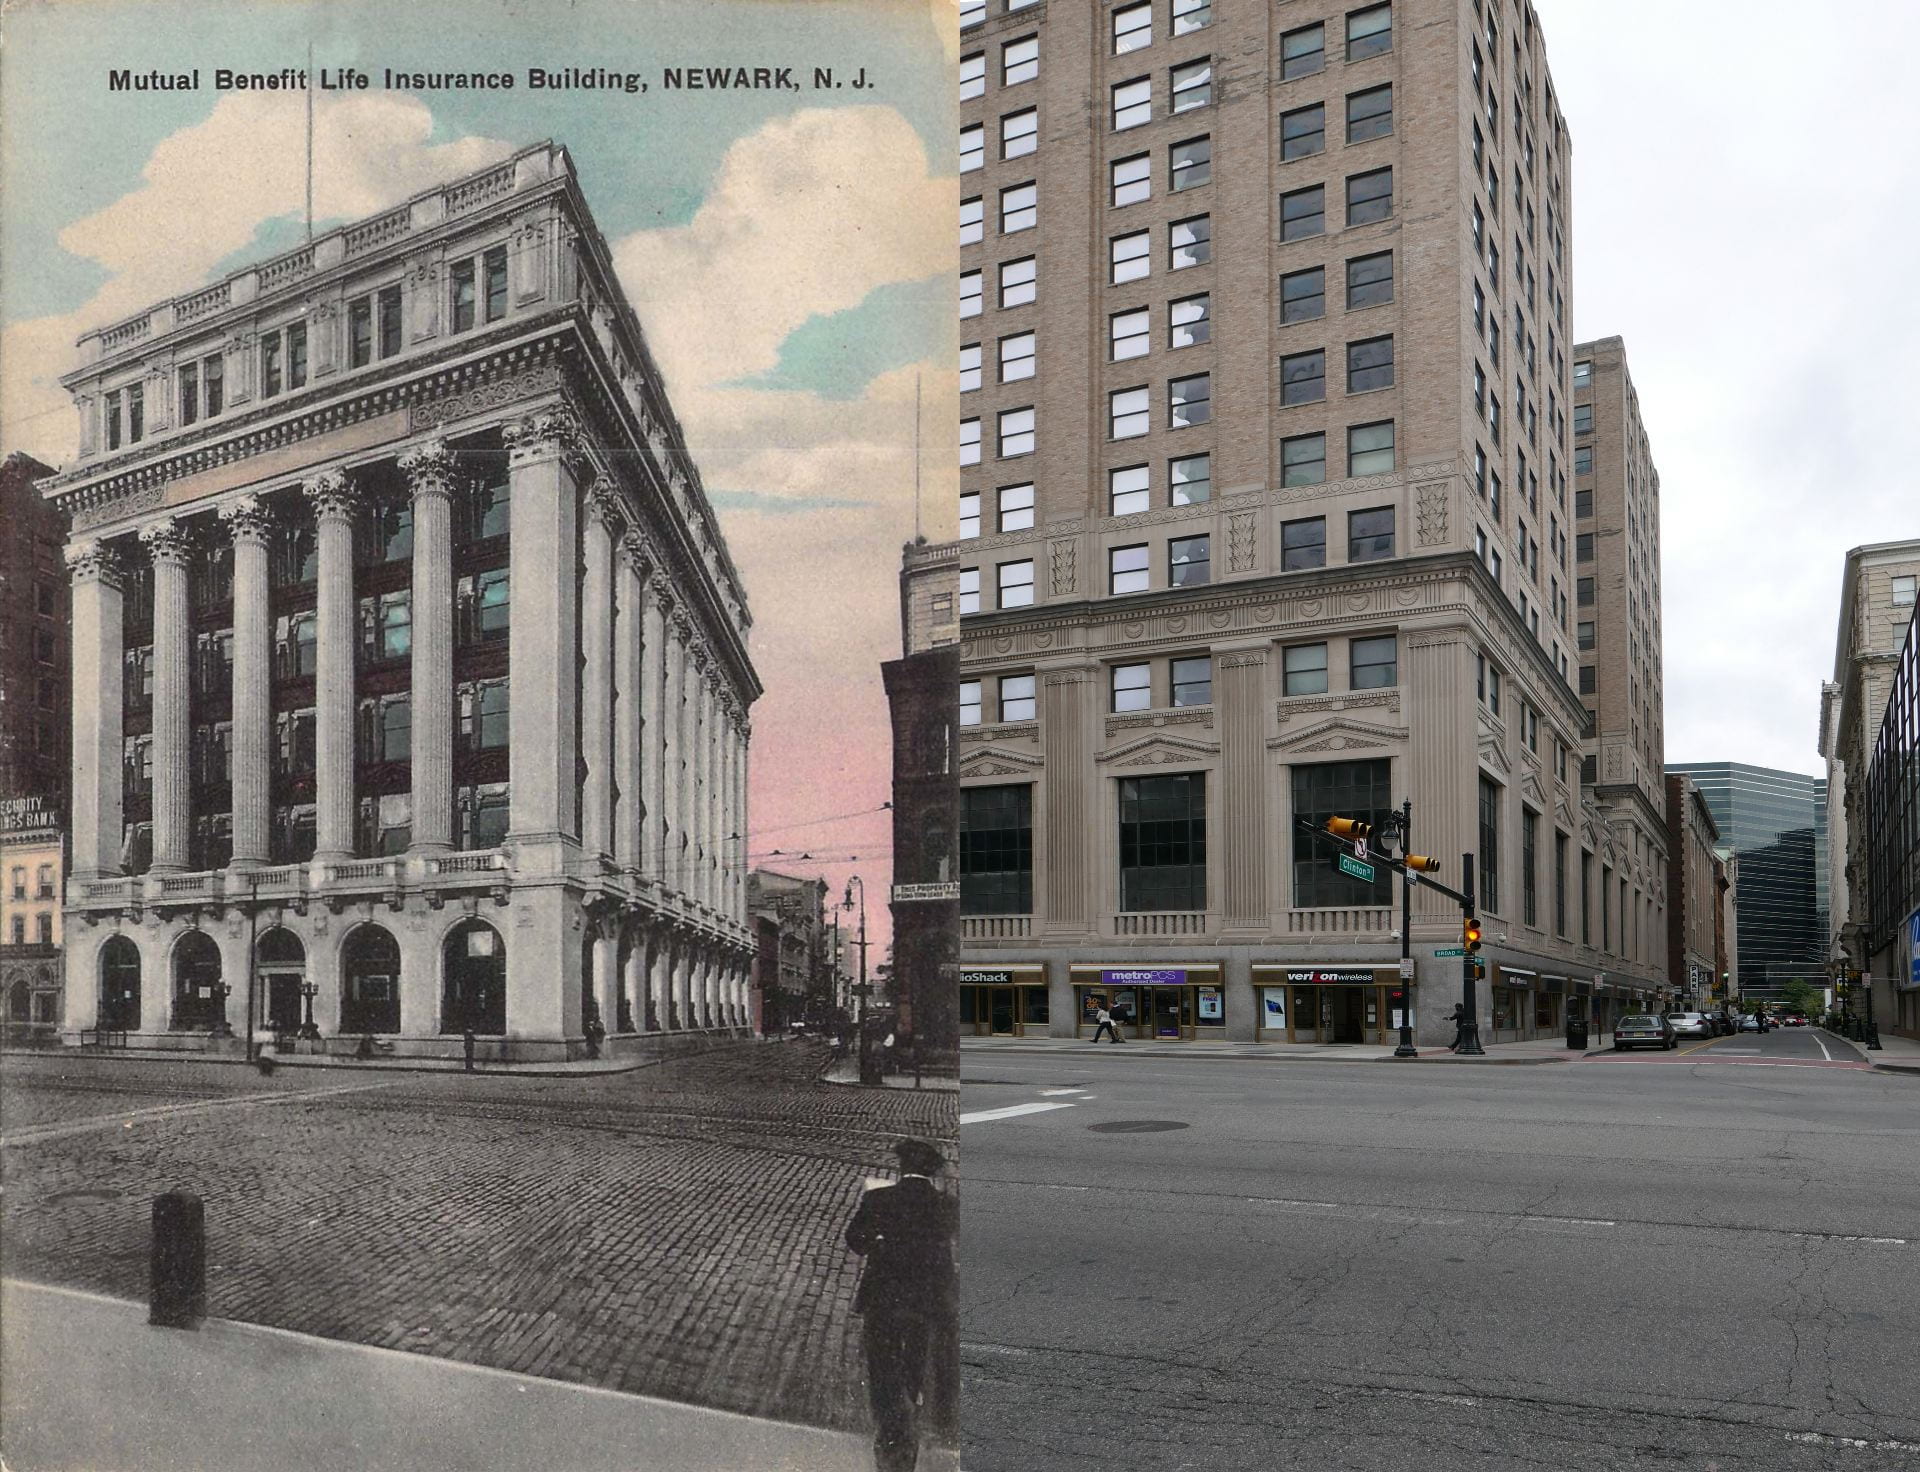
Like many 19th-century insurance companies, Mutual Benefit saw its Newark headquarters as an advertisement to customers. Grand palaces to commerce modeled after the civic structures of ancient Rome would have symbolized to customers that this was a safe and permanent place to park their money. The logic followed that the taller and more imposing the monument, the more powerful and wealthy the company that built it. And a monument it was: eight stories of white Dover marble, copper-framed windows, and ornament copied from the temples of ancient Rome. The first floor was a banking hall lined with Vermont marble, while the floors above contained offices. Richly decorated cornice crowned the building. Behind this windowless cornice was an entire fireproof floor of life insurance records for the company’s thousands of policyholders. In other words, in its original form, the powerful and weighty Lorch Column supported the weight of nothing more substantial than the paperwork of bureaucracy.
Architect George B. Post modeled the four Corinthian columns and temple portico after the New York Stock Exchange he had completed a few years earlier. Comparing the details of the Lorch Column to the New York Stock Exchange, you will see they are almost identical in height, material, and ornament. The New York Stock Exchange was, in turn, modeled after the Roman Pantheon. A Roman temple to the gods had become an American temple to capitalism.
When erecting the structure that would eventually become the Lorch Column, Post faced stiff competition. His building was on Broad Street, Newark’s main commercial street, which was lined with dozens of other insurance companies and banks. After Hartford, Connecticut, Newark had the country’s second largest concentration of insurance companies. Across the street, there was the even larger home of the Prudential Insurance Company, built in stages by Post and Cass Gilbert. To the thousands of downtown commuters and life insurance policy shoppers, Mutual Benefit needed to one-up the competition. As The New York Architect wrote in 1909: “The problem was to design a building as different as possible from the Prudential Building and at the same time make it indicative of the strength and greatness of an important insurance company.” After some thought, Post concluded that since Prudential’s building was a granite castle in the Gothic style, his building for Mutual Benefit should be a marble palace in the Neoclassical style. In this way, the two structures and two companies would play off of each other: the industrial laborers and proletariat who purchased from Prudential’s Gothic castle vs. the upper-class and bourgeois clients who purchased from Mutual Benefit. For thousands of downtown shoppers and commuters, the two buildings stood on opposite sides of Broad Street, framing the entrance to downtown. The giant columns, Post reasoned, would be a fitting advertisement to the upper-class life insurance policy holders Mutual Benefit needed. So ironically, before what is now known as the Lorch Column met its own untimely death, it was an advertisement for others to insure against their own deaths.
.
.

In the turn of the century view of downtown Newark, one sees the architectural styles popular at the time: stone and granite victorian and gothic structures. At left, is Prudential’s old headquarters demolished in 1956. At left, is Newark’s central post office. Unlike today, the postal service was central to the functioning of society and was often the most important structure in a town. This post office happens to be in the Romanesque Style popular in the 1880s. After the post office outgrew this structure and moved elsewhere in 1934, the structure was soon demolished in the 1940s to 1950s to construct an unimpressive dollar store. All buildings in this image are currently demolished.

Prudential’s first major headquarters was an imposing 19th century fortress with gothic turrets and thick walls that were much in vogue in the Victorian age. In a city where much of the residential and commercial artchitecture was not built to last, Prudential’s new headquarters gave an image of stability and permanence. Perhaps, a building as solid as this is only fitting for a company whose logo is the Rock of Gibraltar. Nonetheless, the solidity of this structure was no match for changing tastes and a growing company. This granite palace was demolished in 1956 to construct the smaller marble box visible today.
Prudential Headquarters (across the street from Mutual Benefit, also demolished)
.
Why was Mutual Benefit’s home demolished, despite its at-the-time cost of $1 million, its grand columns, and its important architect? The calculated logic of capitalism dispenses with history whenever the next and newest building can deliver its owner more profit in the name of progress. By 1925, Mutual Benefit moved shop to a larger building two miles away and sold its old home to the National Newark and Essex Bank. Looking to turn a profit in the overheated 1920s real estate market and to build a suitable monument to their own corporate power, the new owner demolished the six-floor Corinthian palace to erect a 35-floor tower of its own. Opened 1929, the National Newark Building was the tallest tower in New Jersey with its ornate temple roof modeled after the Mausoleum at Halicarnassus, one of the lost seven wonders of the ancient world.
In another twist of fate, William Starrett, who attended the University of Michigan and whose company built the Empire State Building, gifted the column to U-M. While the National Newark Building was inspired by a wonder of the ancient world, the Empire State Building is listed as one of the seven wonders of the modern world. Like the 102-floor Empire State Building, the 35-floor National Newark Building was finished just as the stock market crashed. Both entered the Great Depression as largely empty buildings that were urban monuments to corporate ego — hence, the Empire State’s early nickname the “Empty State Building.”
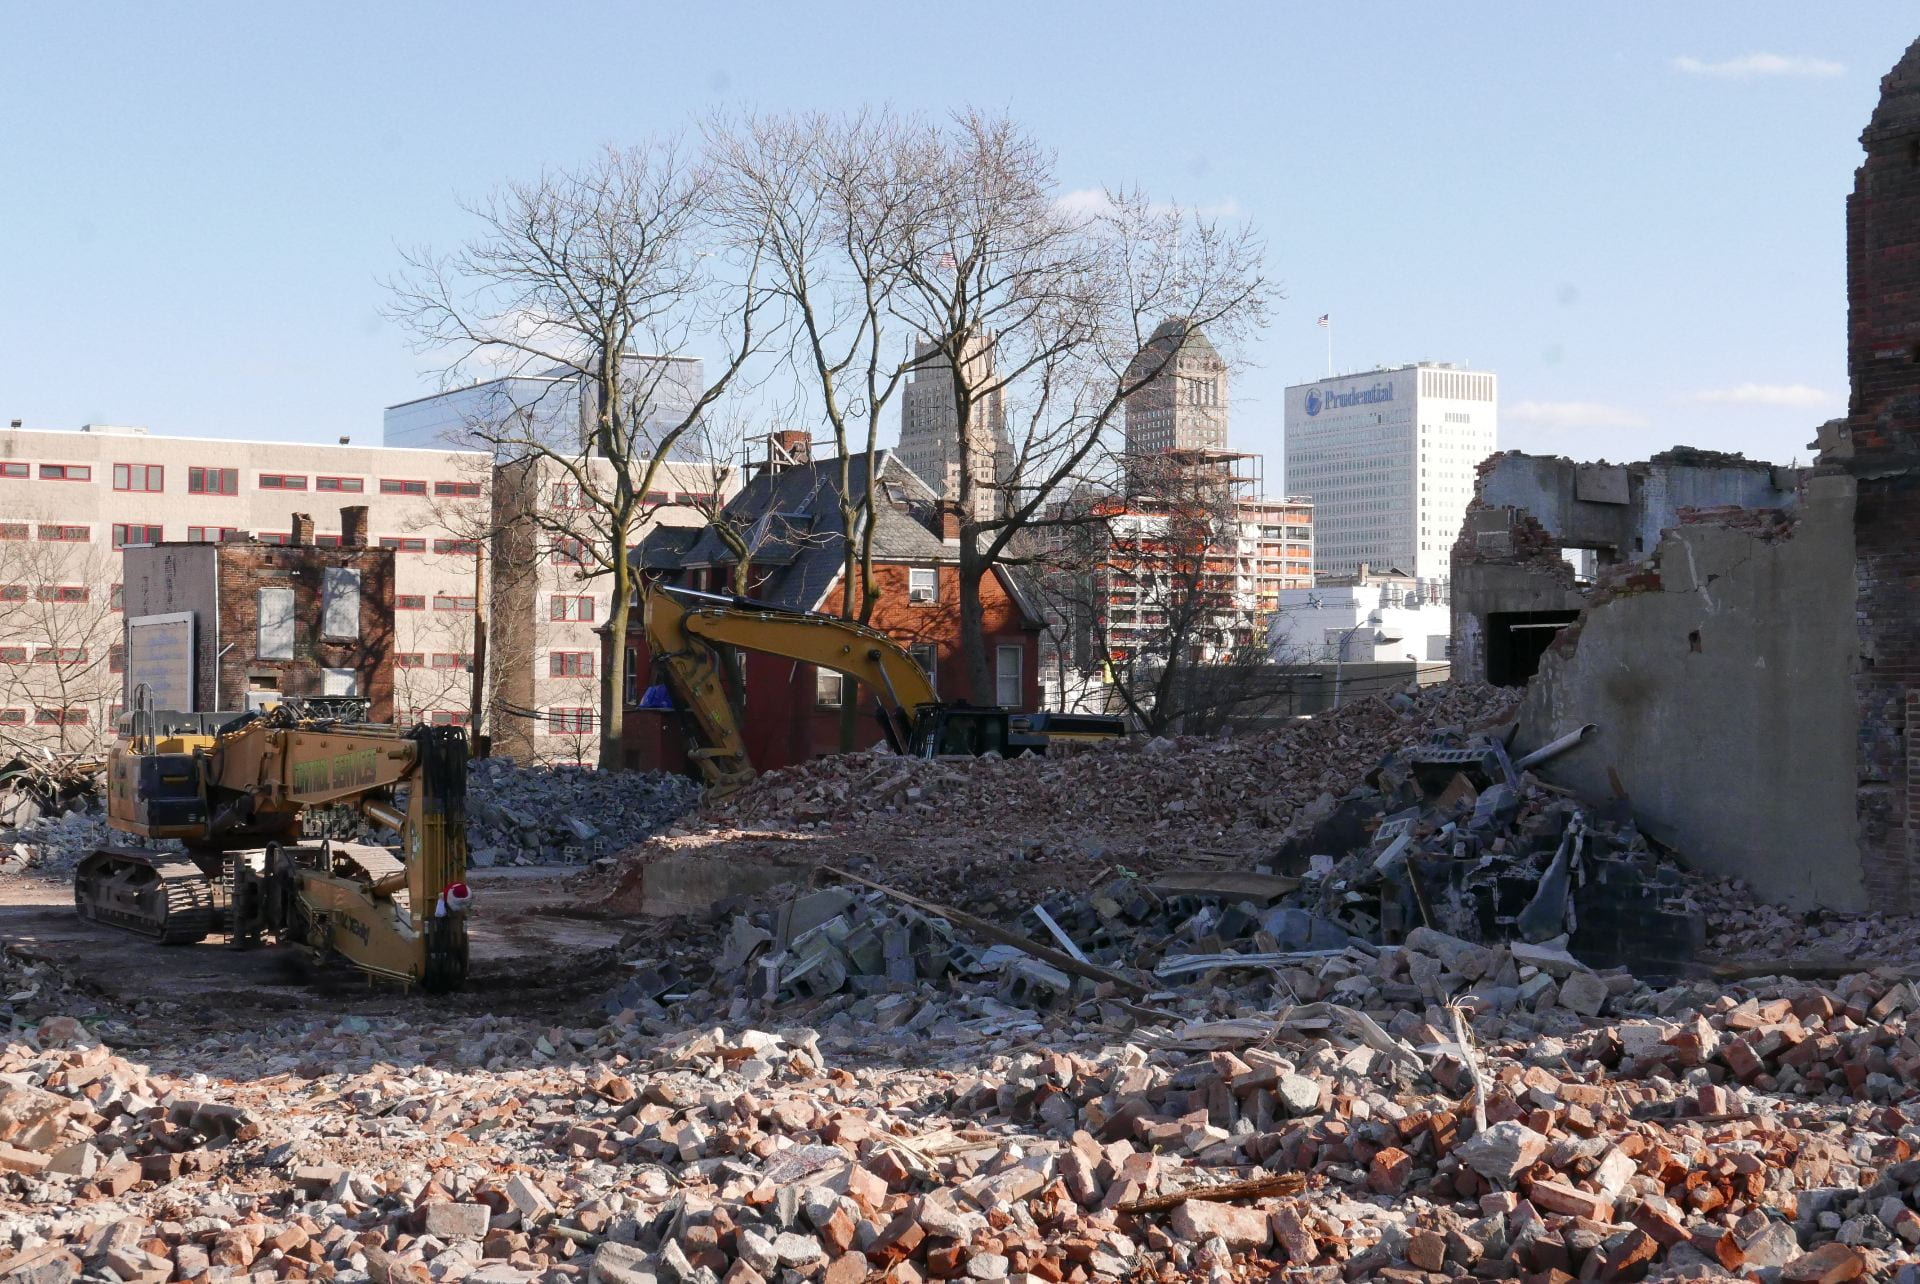
Ironically, the Lorch Column built, in the image of Roman columns that survived 2,000 years, barely survived 20 years. In the end, it was not time or nature or war that brought down the column; instead, the same calculated logic of profit and real estate that built this column demolished it shortly after.
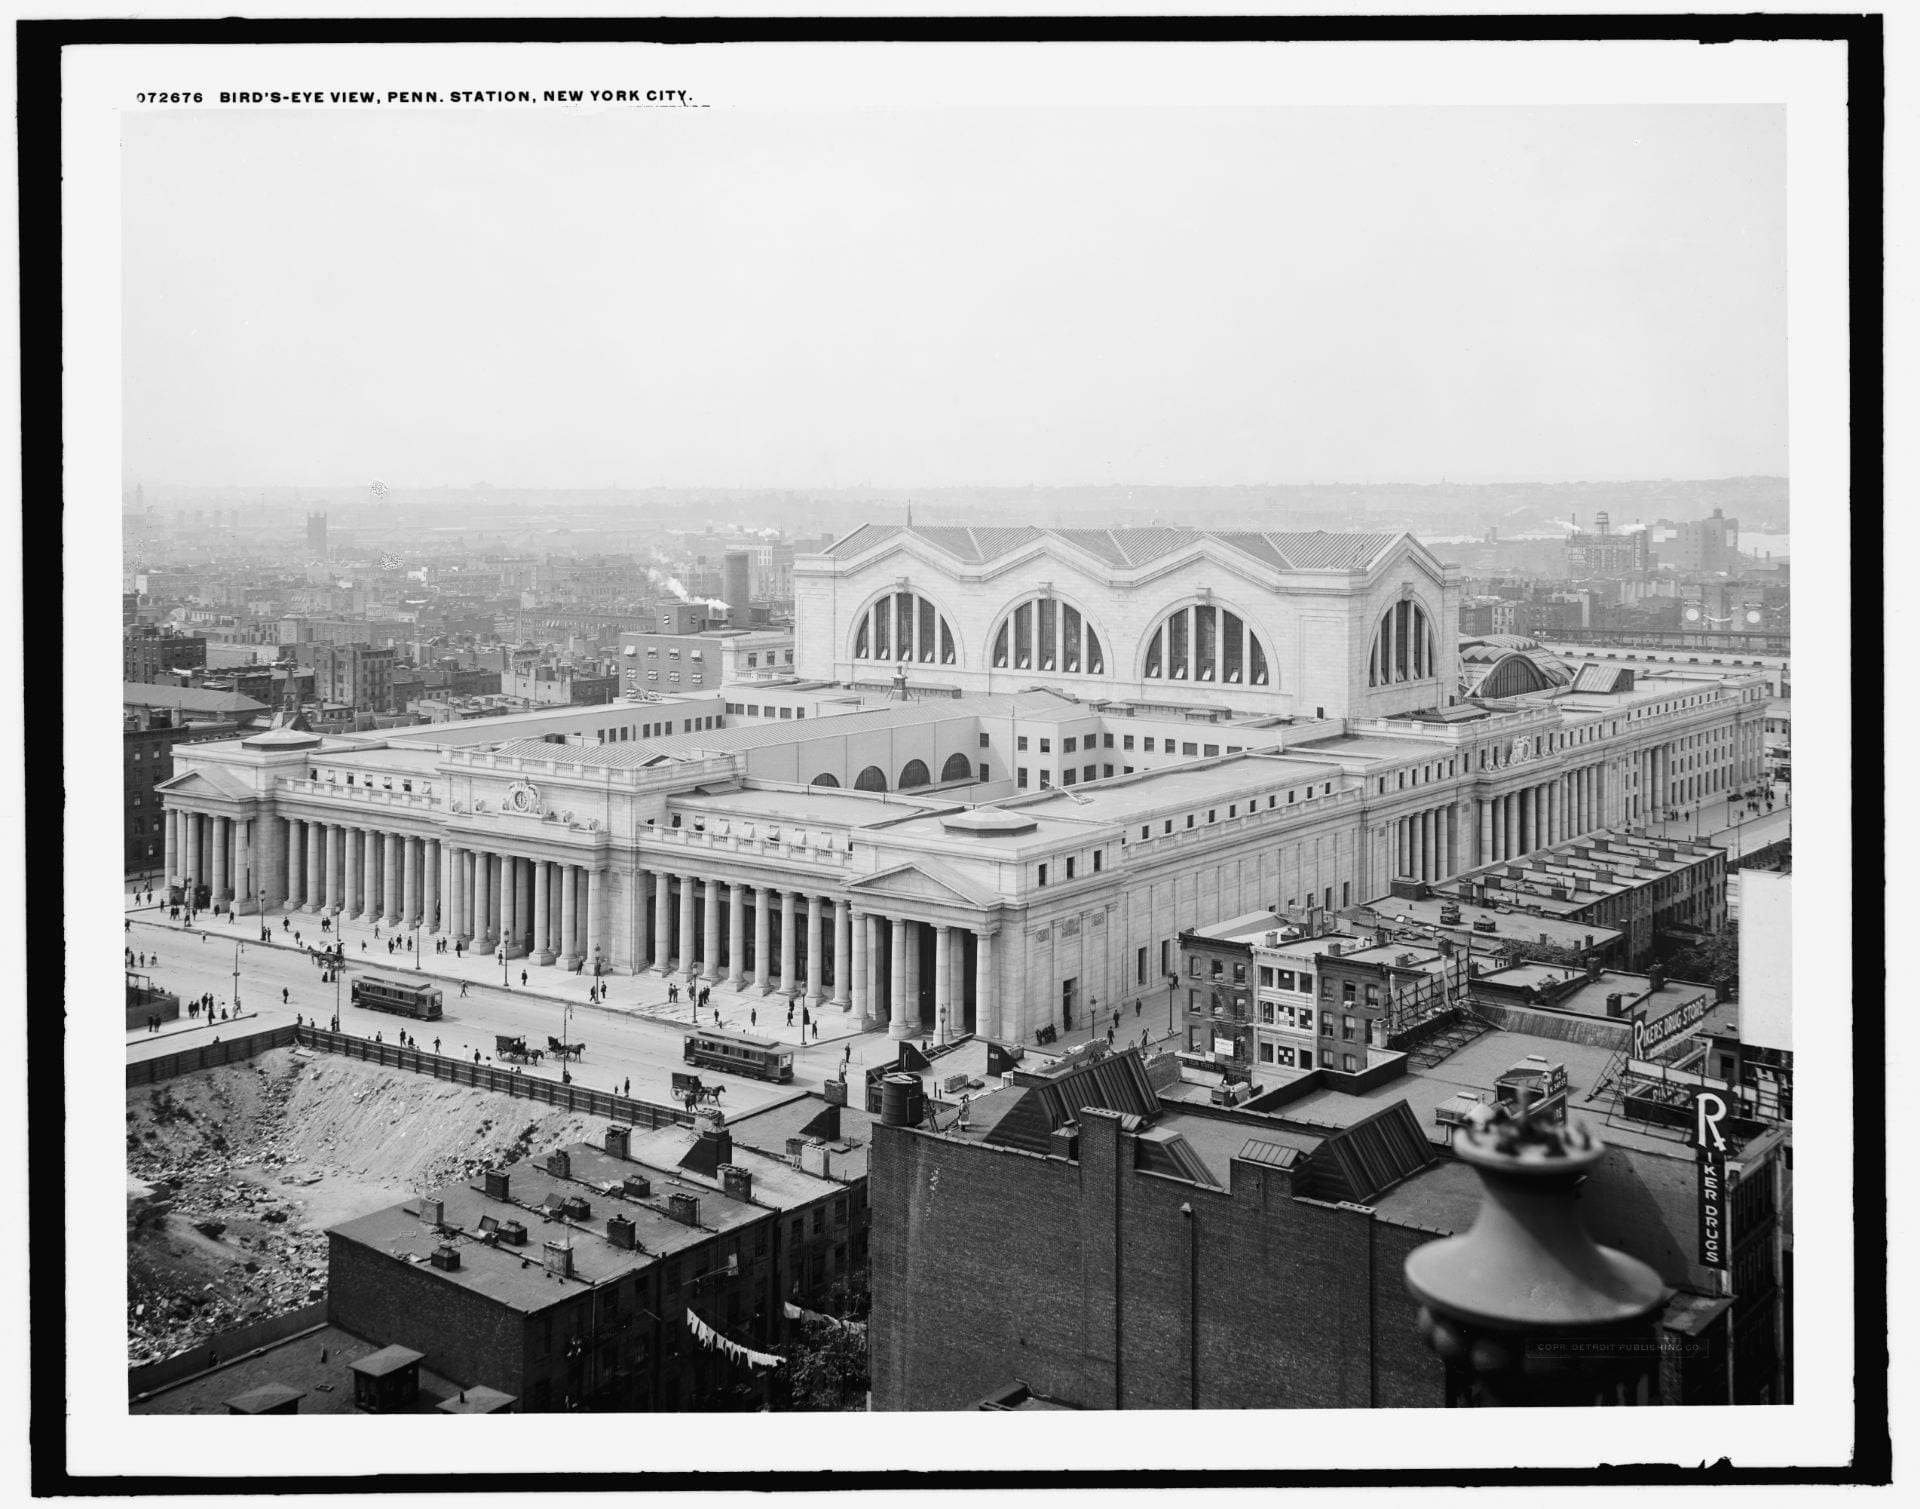
As the American writer Kurt Vonnegut would say: “So it goes.” One monument to commerce replaces another. If not for the foresight of Emil Lorch, the first dean of Michigan’s architecture school, to accept the gift of this column, it likely would have ended in the landfill. As demolition crews hacked away at the monumental old New York Penn Station and carted its carcass to the landfill, architectural critic Ada Louise Huxtable condemned its demolition. Her 1963 New York Times article about old New York Penn Station speaks to the fate of that train station as much as to the fate of the Lorch Column:
.
It’s not easy to knock down nine acres of travertine and granite, 84 Doric columns, a vaulted concourse of extravagant, weighty grandeur, classical splendor modeled after royal Roman baths, rich detail in solid stone, architectural quality in precious materials that set the stamp of excellence on a city. But it can be done. It can be done if the motivation is great enough, and it has been demonstrated that the profit motive in this instance was great enough.
Like the column that once advertised corporate strength but fell when the financial winds changed, Mutual Benefit Life Insurance itself fell apart in 1991. One of several reasons: investments in Florida real estate that never paid off and left the company bankrupt. By the 1950s, Mutual Benefit had become entangled in financing real estate; their largest projects included Mies van der Rohe’s Lake Shore Drive Apartments in Chicago. Mutual Benefit’s fall was, to date, the largest bankruptcy of a life insurance company in American history. The company’s assets were sold off, and the Newark buildings it still owned were sold to the Kushner family, who is now better known for their relationship with Donald Trump than for their real estate speculation.
In its afterlife as the Lorch Column at Taubman College, fate still follows the old column. It was capital and a desire to attract customers that motivated Mutual Benefit to build such a large column. It was capital and a desire to make more money that motivated the National Newark and Essex Bank to tear down this column. And it was success in real estate development that enabled Al Taubman to make a substantial donation to the architecture school that now bears his name. In a fitting metaphor for the power of capital to make or break architecture, the architecture school’s old home on the Central Campus, where the Lorch Column was first displayed, is now U-M’s Department of Economics. Where this column goes next in its journey across space and time is anyone’s guess. One thing is for certain though, even something carved in stone can change meaning depending on time and place and fate. “So it goes.”
.
Related: Essay on the Demolition of Old New York Penn Station
.


 .
.