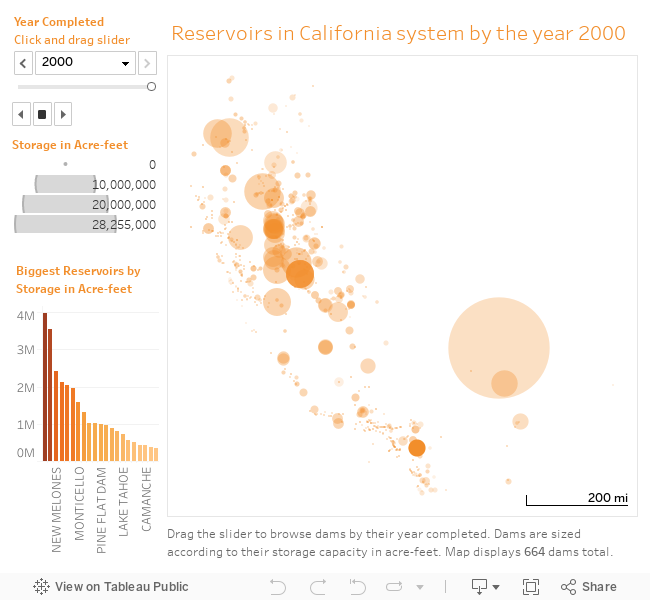
Developed with Max Sternberg, historian at the University of Cambridge
.
Presentation
Paper delivered 6 March 2020 at the University of Cambridge: Department of Architecture
As part of my Master’s thesis in Architecture and Urban Studies
.
.
Digital Reconstruction
Created in SketchUp. Based on original drawings and plans of the prison.
All measurements are accurate to reality.
.
With ambient music from Freesound
.
Eastern State Penitentiary was completed in 1829 in northwest Philadelphia, Pennsylvania by architect John Haviland. It was reported as the most expensive and largest structure yet built in America.
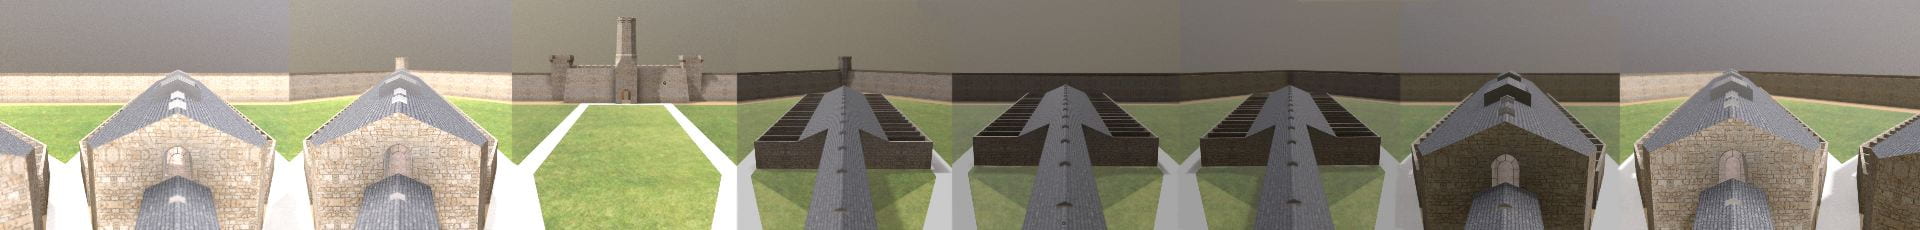
The design featured a central guard tower from which seven cell blocks radiated like a star. This system allowed a single guard to survey all prisoners in one sweep of the eye. A square perimeter wall surrounded the entire complex – thirty feet high and twelve feet thick. The decorative entrance resembled a medieval castle, to strike fear of prison into those passing. This castle contained the prison administration, hospital, and warden’s apartment.
As we approach the central tower, we see two kinds of cells. The first three cell blocks were one story. The last four cell blocks were two stories. Here we see the view from the guard tower, over the cell block roofs and over the exercise yards between cell blocks. Each cell had running water, heating, and space for the prisoner to work. Several hundred prisoners lived in absolute solitary confinement. A vaulted and cathedral-like corridor ran down the middle of each cell block. The cells on either side were stacked one above the other. Cells on the lower floor had individual exercise yards, for use one hour per day. John Haviland was inspired by Jeremy Bentham’s panopticon. (Don’t know what the panopticon is? Click here for my explanation.)
Over its century in use, thousands visited and admired this design. An estimated 300 prisons around the world follow this model – making Eastern State the most influential prison ever designed.
.
360° panoramic view from guard tower
.
Computer Model
Shows prison as it appeared in the period 1836 to 1877 before later construction obstructed the original buildings.
.
.
Research Paper
Eastern State Penitentiary’s exterior resembles a medieval castle. More than a random choice, the qualities of Gothic attempt to reflect, or fall short of reflecting, the practices of detention and isolation within. Contrary to the claim often made about this structure that the appearance was supposed to strike fear into passerby, the use of Gothic is in many ways unexpected because of its untoward associations with darkness and torture, which the prison’s founders were working to abolish. It is therefore surprising that America’s largest and most modern prison should evoke the cruelties and injustices of the medieval period. The choice of Gothic appearance, and the vast funds expended on the external appearance few inmates would have seen, leads one to question the audience of viewers this penitentiary was intended for – the inmates within or the public at large?
This essay responds by analyzing what the Gothic style represented to the founders. The architectural evocation of cruelty and oppression was, in fact, not contradictory with the builders’ progressive intentions of reforming and educating inmates. This prison’s appearance complicates our understanding of confinement’s purpose in society. The two audiences of convicted inmates and tourist visitors would have received and experienced this prison differently, thereby arriving at alternative, even divergent, understandings of what this prison meant. More than an analysis of the architect John Haviland and of the building’s formal qualities in isolation, this essay situates this prison in the larger context of Philadelphia’s built environment.
.
Acknowledgements
I am indebted to my supervisor Max Sternberg, to my baby bulldog, and to my ever-loving parents for criticizing and guiding this paper.
.
Continue reading paper.
Opens in new window as PDF file.
.


Three-dimensional floor plan

Floor plan showing extent of vision from central guard tower

View of cellblocks and guard tower

View from northeast

View from southeast

View from guard tower

Individual exercise yards

Cross section cell block 4
.


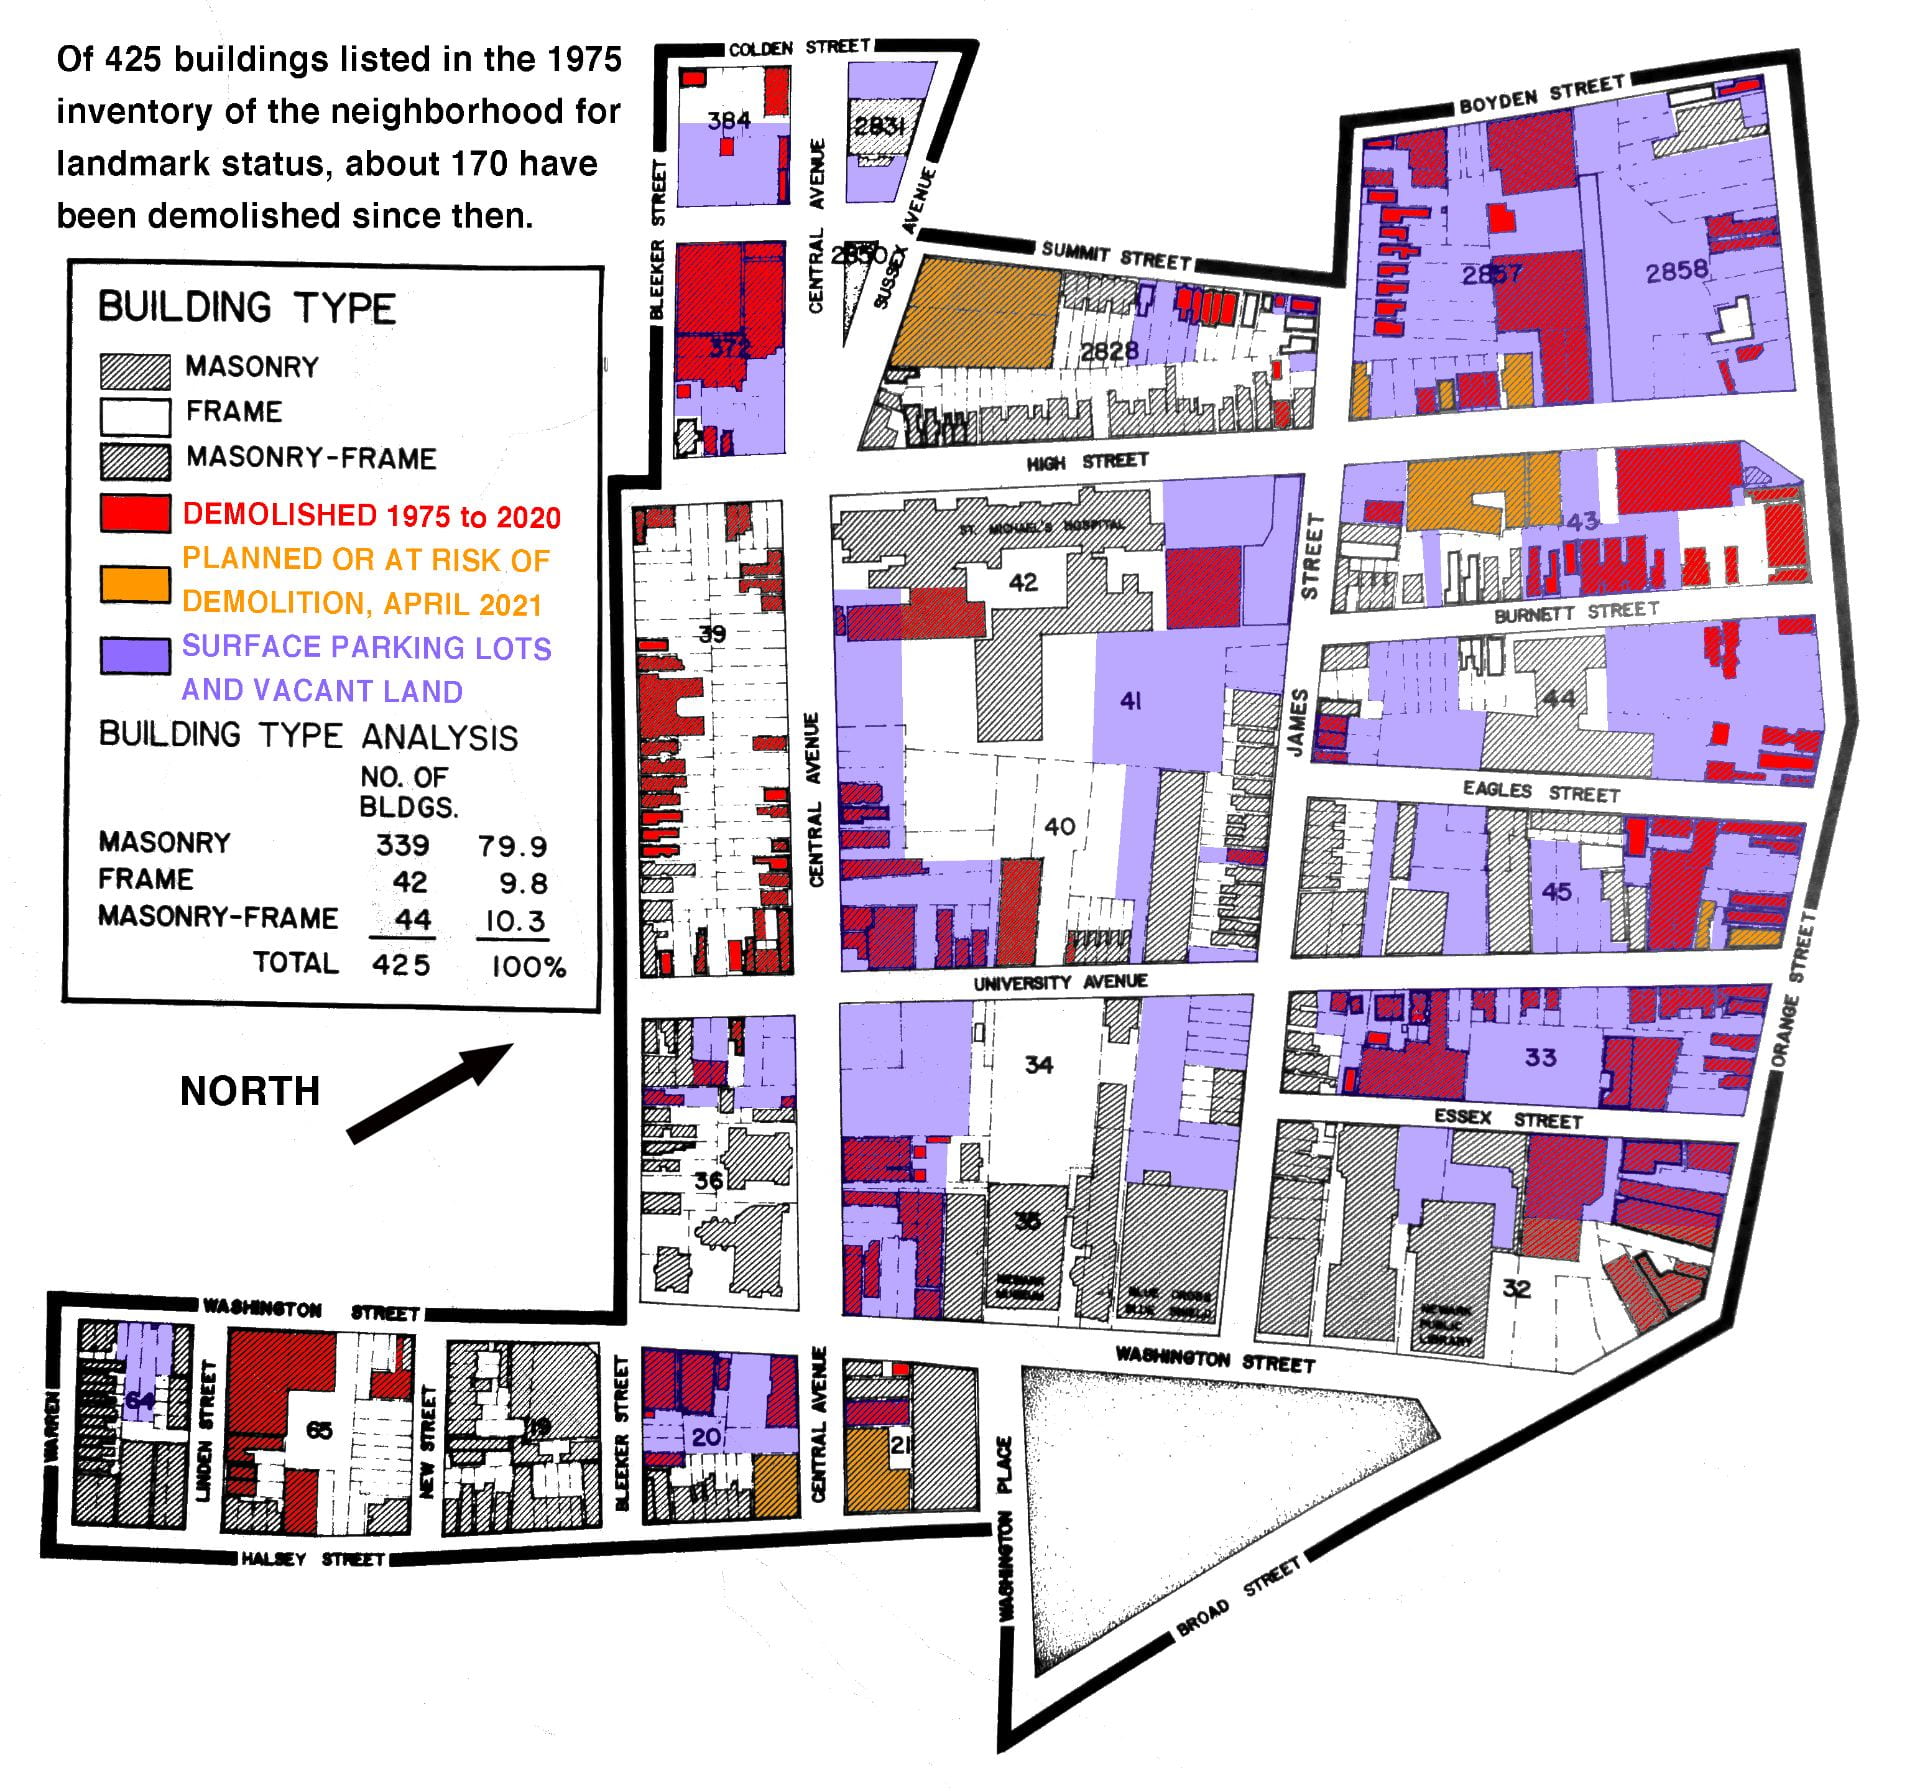
 Explore an interactive map of the 300+ acres of parking in Downtown Newark. This map is part of